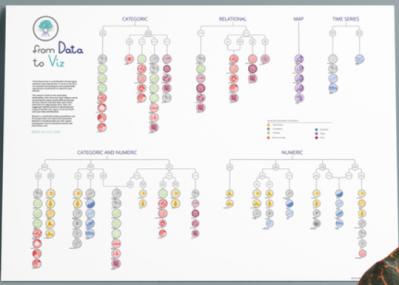
Tom Woodward links to three interesting graphing resources in one post. This first item, a tool for selecting the sort of graphic you want to use, is a number of chart type selections classified according to the number of variables you're looking at. Their poster is probably the best value of the three. If you prefer a more open-ended selection, there's this complete guide to graphs and charts. This page also links to "on-demand courses show you how to go beyond the basics of PowerPoint and Excel to create bespoke, custom charts" costing about $100 per. And how do you make the charts? You could use SciChart, a 'high-performance' Javascript chart and graph library. But the pricing is insane, starting at $116 per developer per month. I'm pretty sure ChatGPT will teach you about the types of charts (actually, I just made one for you while writing this post) and Claude Code will be able to write you a free version of SciChart.
Today: Total: [] [Share]


