

Morning all. Big day at HESA Towers, as we release the State of Postsecondary Education in Canada 2021 (just click on the link, folks). As usual, it has all the good stuff about students, staff, institutional finances, government spending, student financial aid graduate outcomes, but this year it comes in a much prettier package, highlighting the many architectural gems found at universities and colleges across the country. This is phase I of our visual identity/brand refresh that we’ll be rolling out over the next three months, and we’re pretty excited about it. If you have any suggestions for us about the document – especially ideas for additional coverage – just drop us a line at info@higheredstrategy.com: I’d sure love to hear it.
We’d like to thank some sponsors for this year’s edition: ApplyProof, World Education Services, Mitacs, and Pearson. I love giving out free information to my loyal readers, but we gotta keep the lights on.
One of the challenges of writing almanacs like State of Post-Secondary Education in Canada (SPEC)in a time of significant upheaval is the utterly unreasonable length of time it takes for Canadian institutions – in particular Statistics Canada – to produce usable data. Though we have all been living with COVID for over 18 months at the time of writing and at least one institution (Laurentian University) has gone bankrupt at least in part because of COVID, we have very little hard data about what has happened in Canada, either in terms of enrolments or finances. At the time of writing (late August 2021), most Statistics Canada sets for post-secondary education go not further than the 2018-19 school year; and full data for 2020-21 will not be available until around Christmas 2022. This makes the challenge of writing a specific introduction – the one you are currently reading – about Canadian post-secondary education in the wake of COVID – a considerable one.
So instead of looking at the recent past, let us take a longer view to get a sense of what the long-term picture for higher education is, both in Canada and abroad.
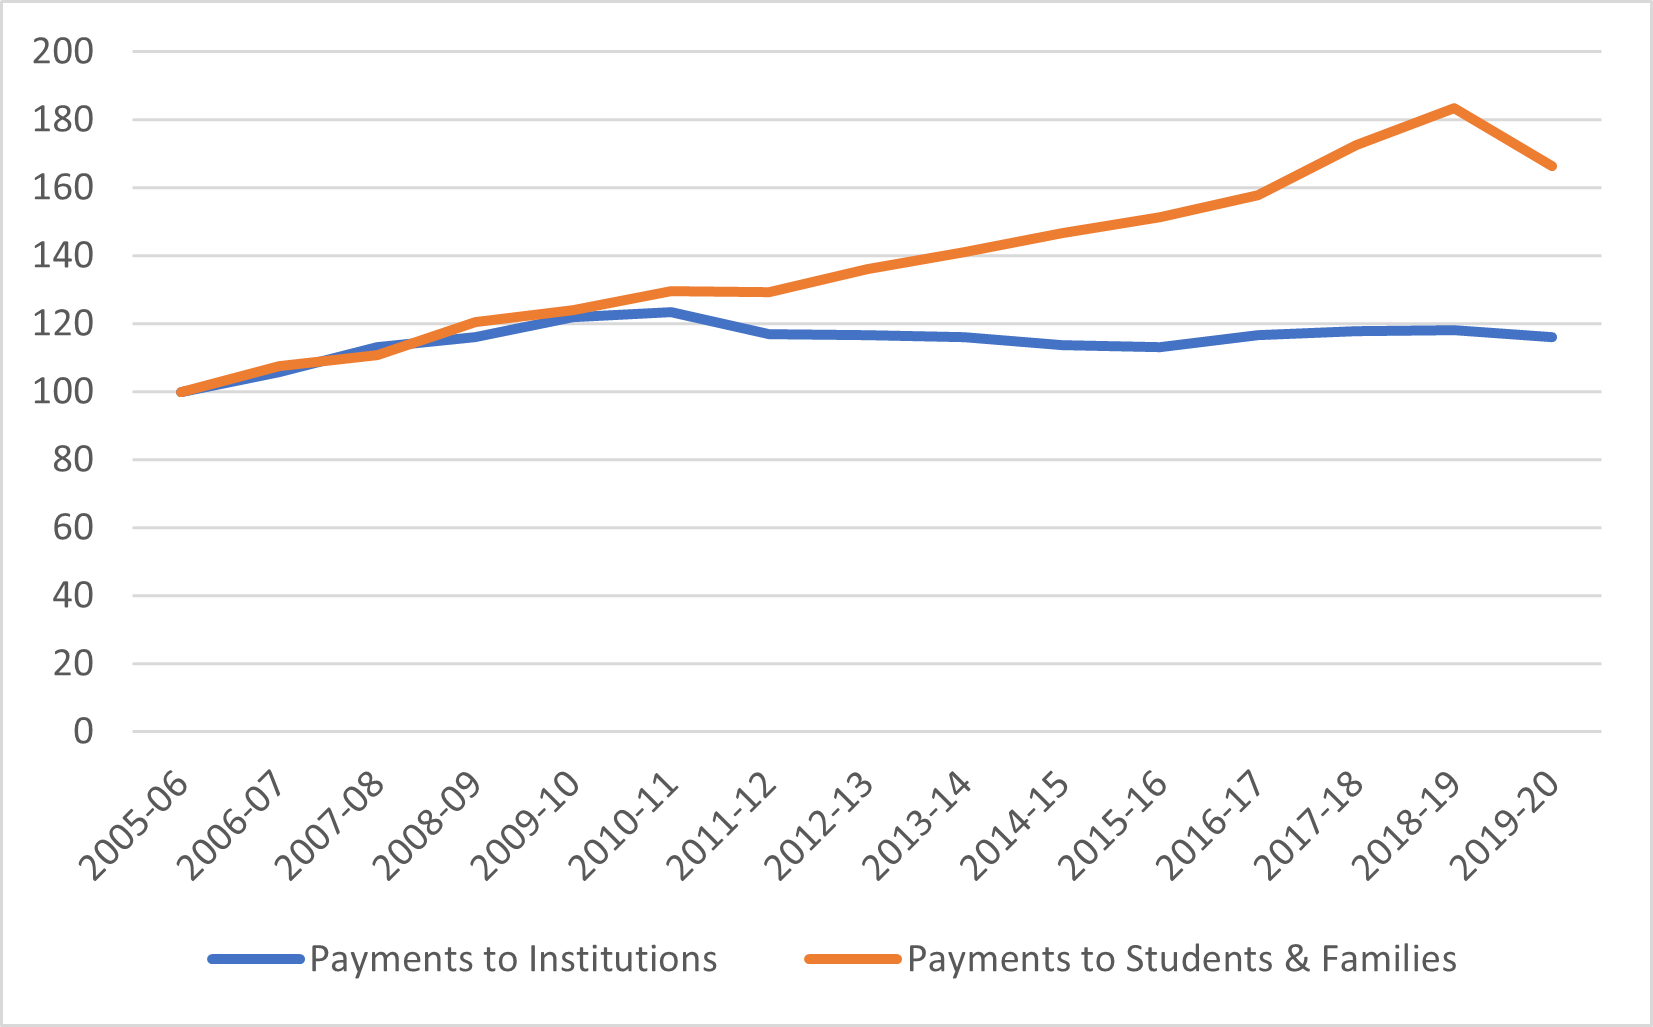
Figure 1 shows total government expenditure on higher education in Canada over the past 20 years; that is, not just transfers to institutions but transfers to students and families as well. As previous editions of SPEC have shown, Canada hit peak funding of higher education institutions a decade ago, in the counter-cyclical spending boom that accompanied the Great Financial Crisis of 2008-2010. But as spending on institutions (including funds for operating capital and research combined) plateaued or even declined, spending on students, though student aid programs of various varieties of non-repayable aid (grants, loan remission, tax credits and Canada Education Savings Grants), continued to increase. In fact, as Figure 2 makes clear, while payments to institutions have been rock steady since 2010-11, payments to students in constant dollars soared 80% over their 2005-06 levels in 2018-19, before falling back somewhat due to significant cuts to student aid by the Ford government in Ontario.
Figure 1 – Total Canadian Government Expenditures
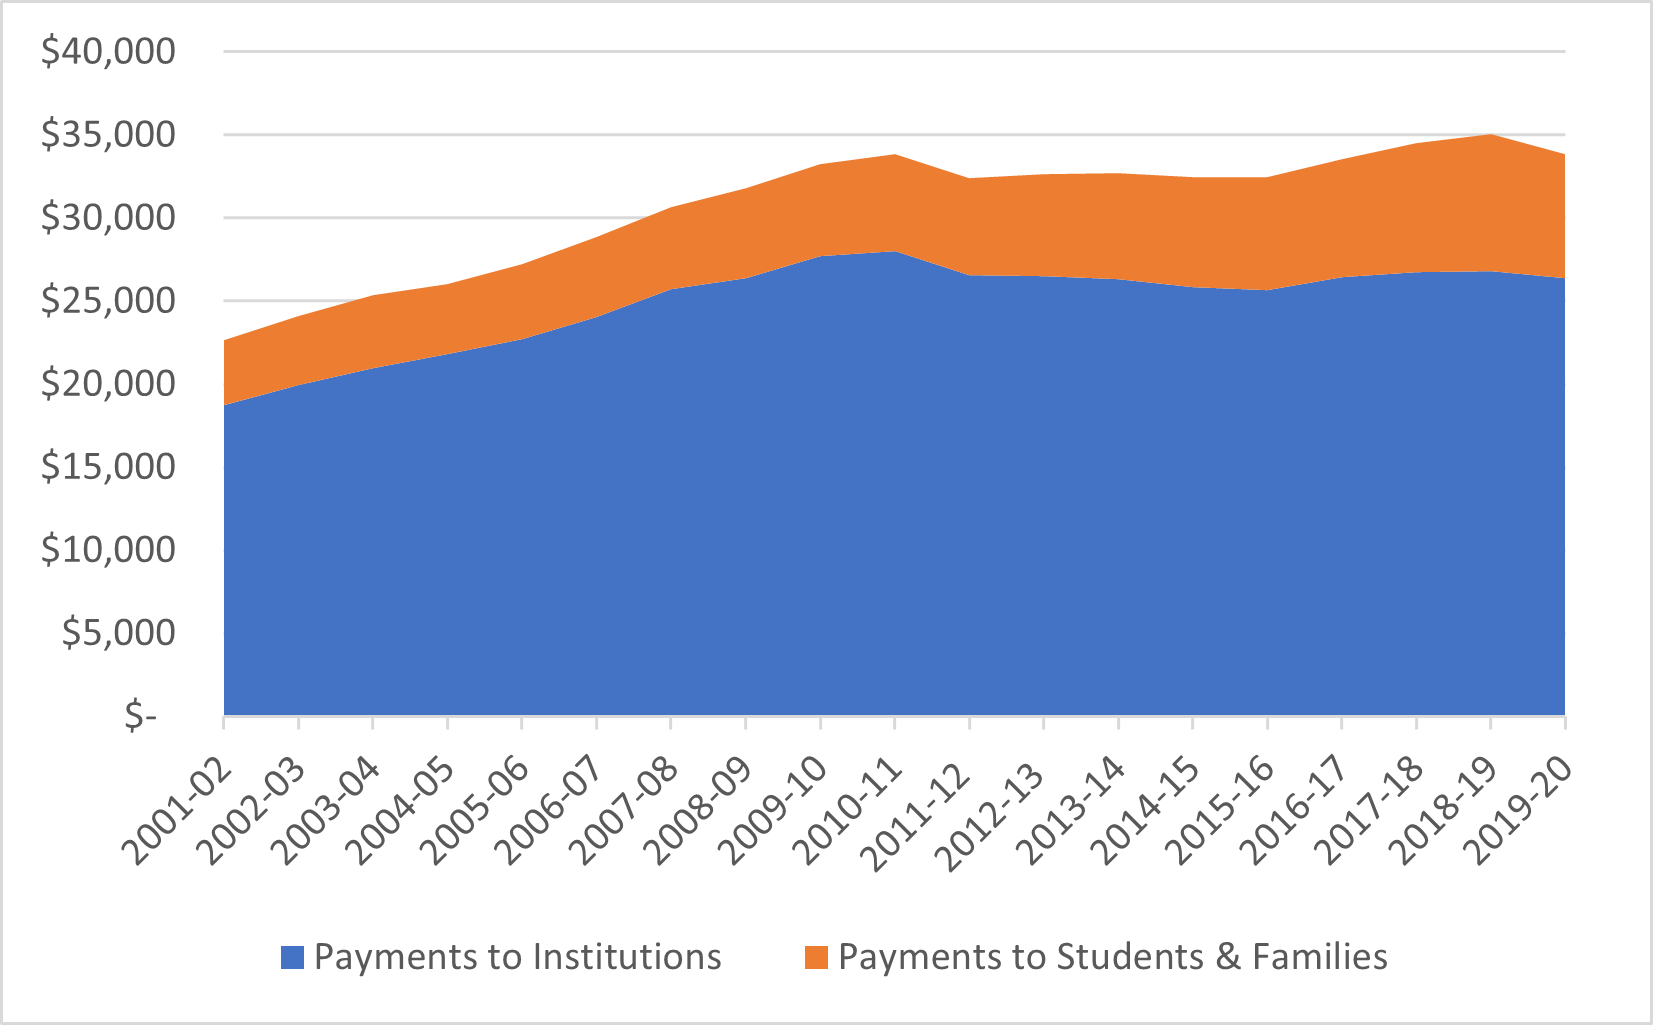
Figure 2 – Change in Real Public Expenditures by Type, Canada, 2001-02 to 2019-20 (2001-02 = 100)
These patterns look somewhat monotonous at the national level, but as one digs deeper to the provincial level, one sees instances of quite significant fluctuation that just happen to even themselves out nationally. Quebec and British Columbia had the slowest growth in total higher education spending among major provinces – just 33% and 38%, respectively since 2001-02; most provinces saw increases of between 42-52%. The two provinces with growth rates significantly higher than the national average since 2001-02 were Alberta, which had super-charged growth between 2004 and 2008 and did not really begin to fall until 2019 when the Kenney government decided to bring expenditures closer to the national average, and – perhaps surprisingly – Ontario, where the anomalously high figure was driven almost entirely through higher student aid spending during the years that Kathleen Wynne was in power.
Figure 3 – Change in Real Total Public Spending 2001-02 to 2019-20, Selected Provinces (2001-02 = 100)
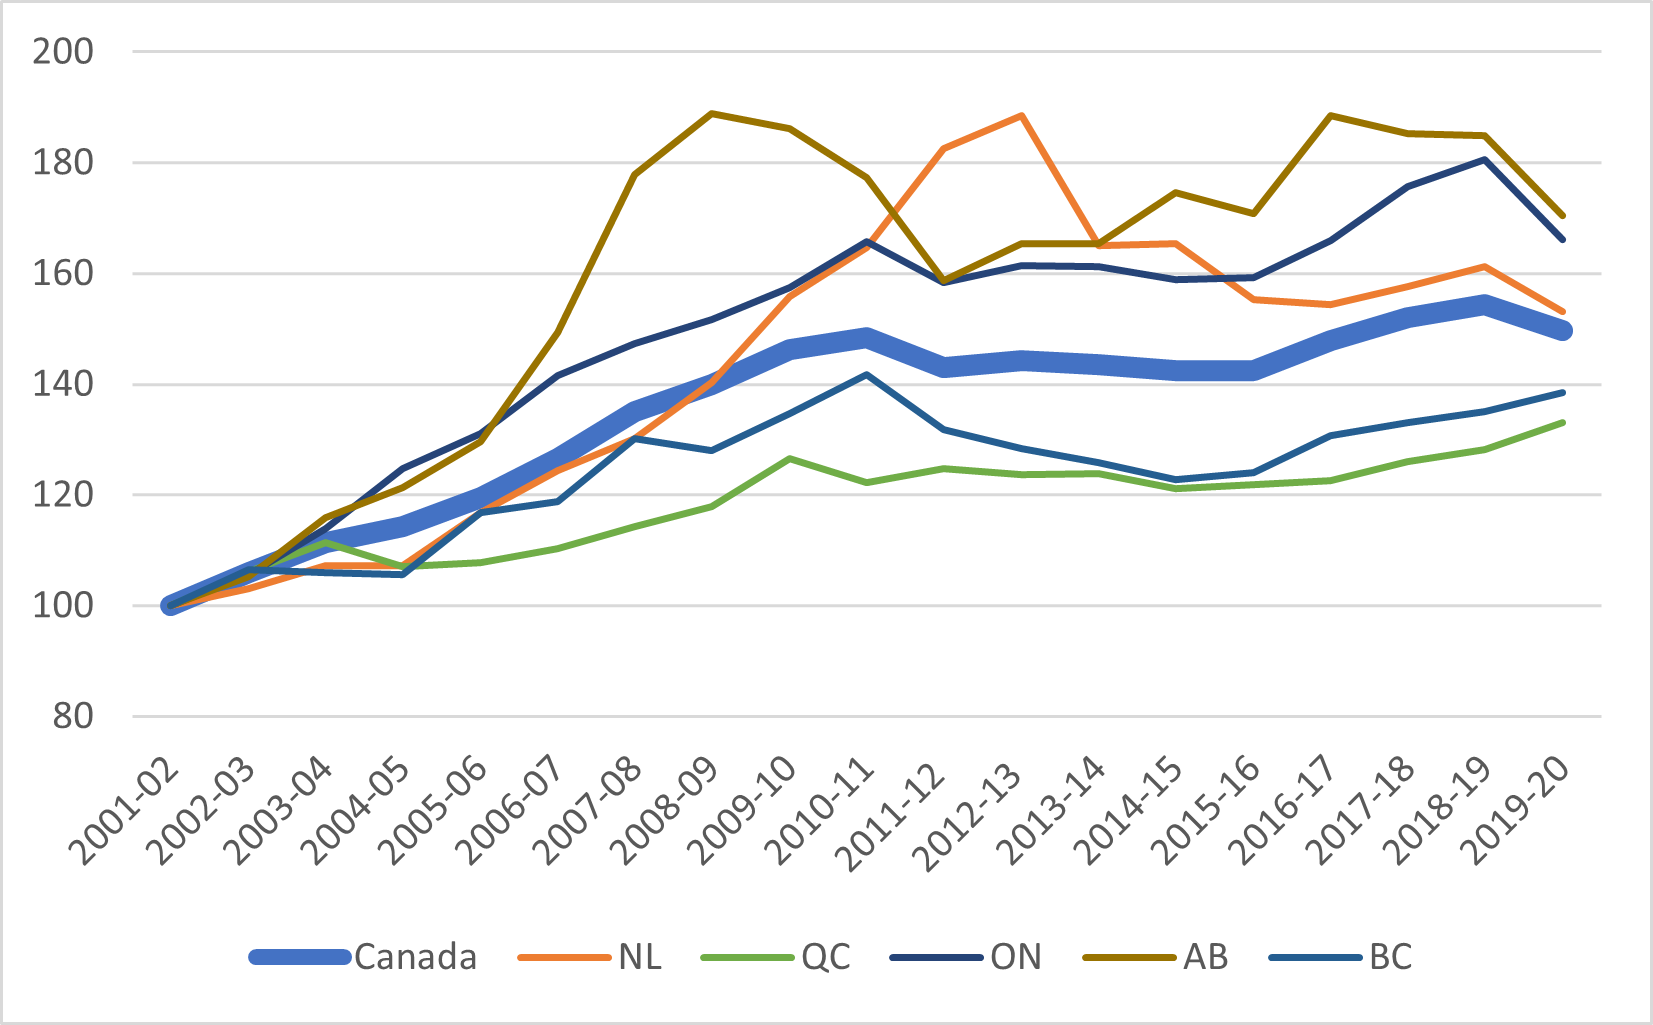
The good news is that some of the long-term laggards in PSE spending (notably Quebec and British Columbia) are increasing their spending. But counteracting that is the decline of public spending in both Alberta and Ontario, neither of which seems likely to increase in the near future. Those two countervailing trends suggest that nationally, the steady-state of public spending of the past decade was likely to have continued even had COVID not hit.
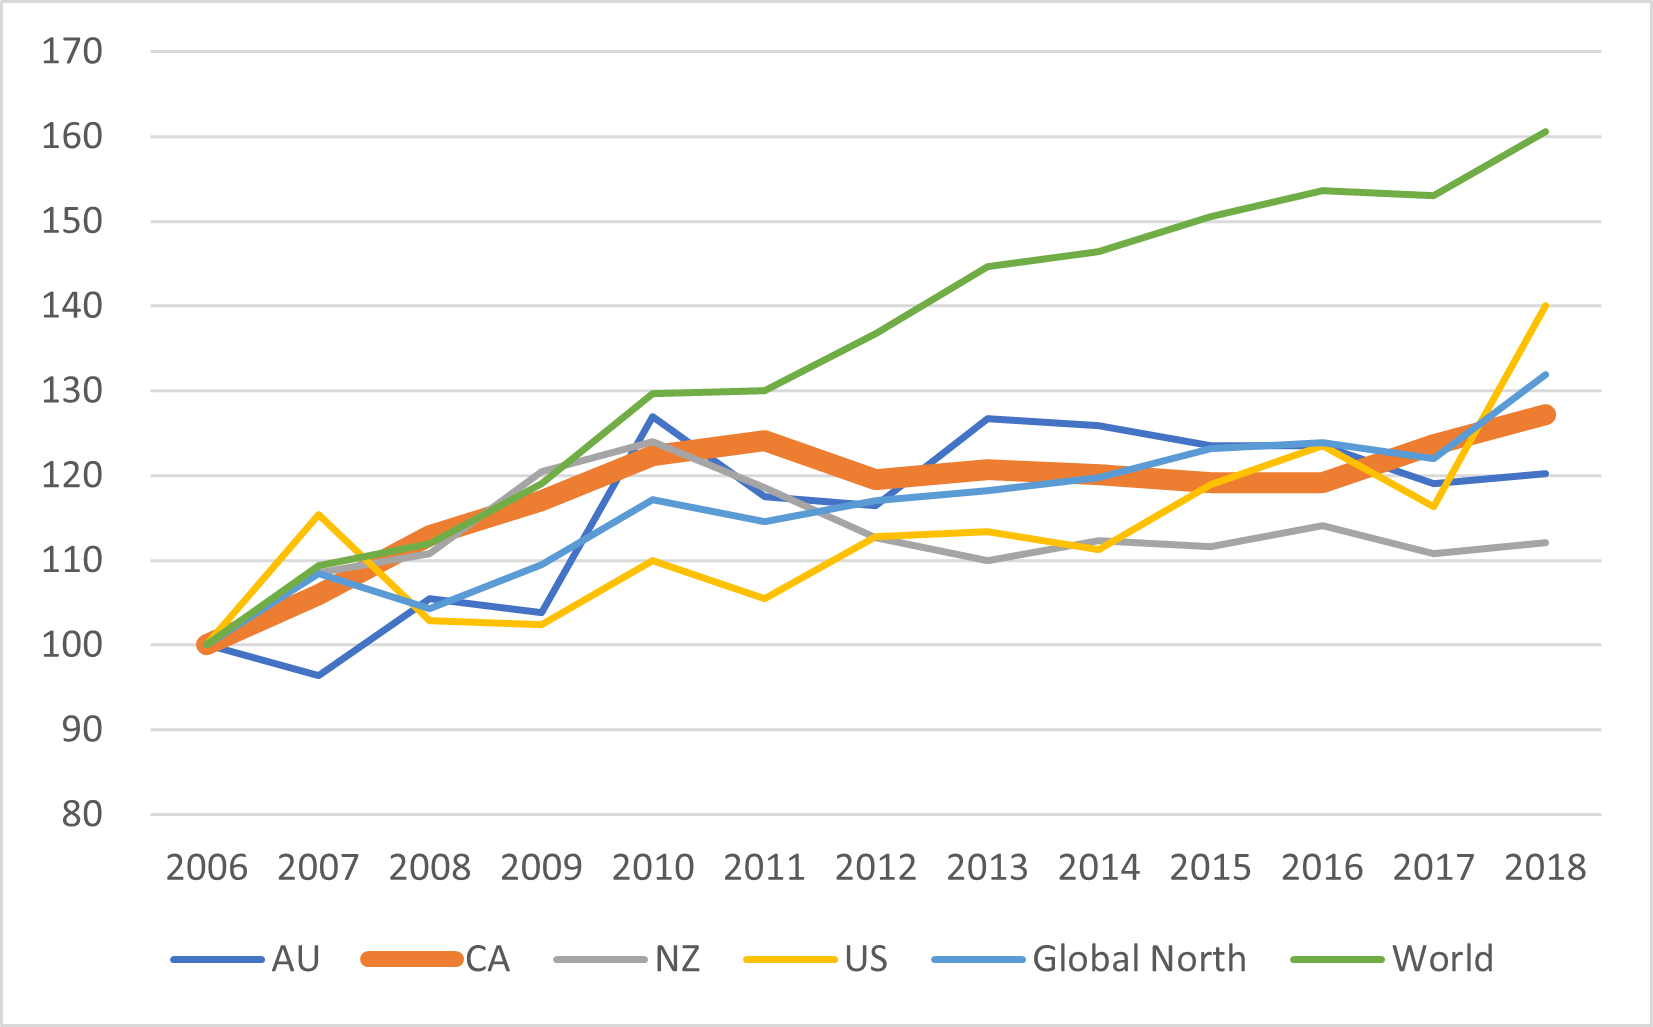
An interesting question to pose at this point Is whether Canada is substantially different from other developed countries? Are there other public funding models out there ready to be plucked? Data from Higher Education Strategy Associates’ forthcoming Global Review of Higher Education: Institutions, Students and Finances suggests not. Figure 4 compares changes in public higher spending on higher education in Canada, the US, Australia and New Zealand, as well as broad averages for the whole world (based on a survey of 56 countries making up over 90% of global enrolments and for the “Global North”, which includes the four countries listed, Europe including all of the ex-USSR, plus Israel, Japan, South Korea, Taiwan, Singapore and Hong Kong. Ignoring the significant fluctuation in the US numbers (a product of the somewhat eccentric way that they account for student loan losses), what we see is that Canada’s experience is very similar to other countries and indeed almost identical to the overall average of the Global North: some growth through to about 2010 and then achingly slow progress (if that) thereafter. Outside the Global North, different outcomes seem to be possible: the world average is up about 60% because in the Global South total spending on higher education more than doubled in real terms between 2006 and 2018. But this is largely a function of faster rates of growth from a lower base: among more developed countries with common challenges of slow growth and aging populations, there simply does not seem to be much in the way of alternative models for Canada.
Figure 4 : Change in Real Total Public Spending on Higher Education, Selected Countries, 2006-2018 (2006=100).
It’s worth remembering of course all of this was before COVID. Before Canada’s governments (not unlike other governments) spent something on the order of $400 billion, or about 20% of GDP, to keep the economy afloat in fiscal 2020-21. Regardless of whether quite so large a sum was necessary to achieve that aim, the fact is that this is a fiscal load that will restrict public spending for at least a decade to come. And, recall, this is a decade in which governments of all stripes have made it very clear both healthcare and childcare will take precedence over everything else.
The long-term choice, therefore, for higher education remains either one in which new revenues are found in the form of international students, or one in which institutions find ways to gradually reduce their spending levels without compromising quality.
Realistically, I don’t see a third way.
 Tweet this post

I’d really like to see a move away from Excel plots and analyses. Suggest moving to R markdown even for the blog, will look way better.
Thank you for another invaluable report!
On p. 27, you write, “Figure 2.10 shows that the numbers of both full-time support staff and administrative staff have grown a bit more quickly than the number of full-time academic staff over the past ten years.” Of course, this is scrupulously correct, but it’s surprising that you would choose to compare growth in numbers when the base rates are so different. If, instead, growth rates are compared, then (eyeballing the graphs) it looks like about 17% faculty growth, 26% staff growth, and 79% admin growth.