Student Participation in Online Content-Related Discussion and Its Relation to Students’ Background Knowledge


1
Department of Education, University of Helsinki, 00014 Helsinki, Finland
2
Department of Physics, University of Helsinki, 00014 Helsinki, Finland
*
Author to whom correspondence should be addressed.
Educ. Sci. 2020, 10(4), 106; https://doi.org/10.3390/educsci10040106
Submission received: 30 January 2020
/
Revised: 6 April 2020
/
Accepted: 7 April 2020
/
Published: 13 April 2020
(This article belongs to the Special Issue Networks Applied in Science Education Research)
Abstract
:This paper presents two novel network methods developed for education research. These methods were used to investigate online discussions and the structure of students’ background knowledge in a blended university course for pre-service teachers (n = 11). Consequently, these measures were used for correlation analysis. The social network analysis of the online discussions was based on network roles defined using triadic motifs instead of more commonly used centrality measures. The network analysis of the background knowledge is based on the Katz centrality measure and Jaccard similarity. The results reveal that both measures have characteristic features that are typical for each student. These features, however, are not correlated when student participation is controlled for. The results show that the structure and extension of a student’s background knowledge does not explain their activity and role in online discussions. The limitations and implications of the developed methods and results are discussed.
1. Introduction
Several modern university-level courses employ online discussion as a part of blended learning that incorporates contact and distance teaching. The discussions might be voluntary (as peer support) or organized (as exercises connected to other course work). In both instances, the aim of the discussions is to activate students in their learning through collaboration, with the notion that active participation should improve learning outcomes.
Using online discussions to collaborate in learning is a part of a field called computer-supported collaborative learning, or CSCL [1,2]. The pedagogical foundations of CSCL have been laid by Bereiter and Scardamalia’s work on knowledge building [3,4]. Knowledge building is distinct from learning in that knowledge building refers to the public knowledge that students construct together through collaborative efforts. In CSCL, this collaboration is scaffolded with technology. Learning is an individual process that can happen alongside or during the construction of knowledge.
One example of a model for learning in CSCL is the model of collaborative knowledge building by Stahl [5]. In this model, each student has his or her own personal understanding, which is then articulated into public statements. Combining these with other students’ public statements, students create shared understanding and collaborative knowledge. This again leads to personal comprehension and understanding. Thus, knowledge is a product of social communication that can be supported with computers in dedicated knowledge-building environments. According to Stahl [5], one of the most commonly used methods for communication is the online discussion forum.
The field of CSCL is not limited to online discussion, but in the context of higher education, it seems to be one of the most common forms of collaborative learning, and as such, it is widely discussed in research literature. In online discussion, participants present their thoughts in written form. Producing the text requires students to structure and clarify their thoughts for others, and thus allows for longer expressions than would be possible in face-to-face discussions [6].
The research has focused on, for example, participation [7], learning outcomes [8], engagement [9], how learning is regulated [10,11], or how to better facilitate collaboration [12] and scaffold learning [13]. The research shows that online discussions are—and stay—task-oriented [8], that complex thought and high levels of knowledge building seem to be possible [14], and that interactions that involve differing opinions increase discussion, as well as critical thinking [15]. Overall, active participation in online discussions leads to better learning outcomes [8,10]. However, in online discussions, the number of messages in itself does not guarantee the quality of dialogue [16], and it seems that argumentation in a CSCL environment might not increase domain-specific knowledge [17].
Well-organized online collaboration may increase active participation among students and further improve learning outcomes. This is supported by the finding that more active groups achieve better grades [8,10]. In general, CSCL seems to have a positive effect on learning in the field of science, technology, engineering, and mathematics (STEM) education [18].
Successful online collaboration requires an appropriate group size, as small groups achieve higher levels of knowledge building [19], and larger groups risk generating isolates—that is, one or more students being left out of the discussion [20]. On the other hand, small groups do not benefit from online discussions if they meet otherwise, as only some meaningful information is published online [21]. In practice, facilitating students’ learning processes and stimulating interaction are key challenges in blended learning [22].
One aspect that has seen less focus is how each student’s personal understanding affects how they conduct discussion or negotiate perspectives, and there does not seem to be a clear picture of how students’ background knowledge affects their online activities. Pre-tests are usually used only to assess learning outcomes (see, e.g., [12,23]). However, it has been shown that in CSCL, knowing what others know enhances collaborative problem-solving [24] and that students’ backgrounds, which also include prior knowledge, influence how they discuss online [25].
Generally, background knowledge strongly indicates how well students learn new information [26], and in classroom problem-solving exercises, higher prior task-specific knowledge leads to better learning outcomes in individual and collaborative learning [27]. As background knowledge affects learning, it could also be one possible factor affecting students’ online discussions aiming for knowledge construction.
1.1. Analysing Online Discussion
Collaborative learning is a complex process [5], and as such, needs suitable methods of analysis. Analyses of online discussions are focused on texts or part of texts produced by students, or connections between texts [28]. The research in CSCL began with quantitative analyses of the number or length of messages, but has now expanded to include multiple different quantitative and qualitative research methods. These methods include, for example, content analyses, social network analysis, analyses of log-files, and visual representations of data. Various methods have been used to analyse both learning processes and learning outcomes at the group level, as well as on the individual level [29].
Social network analysis (SNA) is defined as a set of network theory methods to analyze social networks [30]. SNA is considered a suitable tool for analyzing patterns of interaction in CSCL [31] and is widely used (see, e.g., [7,32,33]). One advantage of SNA is that the network analysis allows for the investigation of complex systems [34], and modelling collaboration, as a network of connected individuals, thus makes it possible to investigate collaborative learning. A social network consists of social entities or actors as nodes, and relationships between them as edges. In the social sciences, one of the most common SNA measures is the various centralities [35], and the same holds true for SNA in CSCL [33]. Centrality refers to a node’s position with respect to other nodes within the network. For example, degree-centrality refers to the number of edges a node possesses, and two nodes with similar centrality have a similar position. The general interpretation is that the more central a node is, the more relevant it is. In an online discussion, this would mean that a person with high centrality would have a more prominent part in the dialogue.
The position of a node does not tell us much about the structure of its connections or, in the online discussion, the actual pattern of communication. The investigation of these patterns within the network is possible using network roles [30]. In everyday talk, a role might have several different meanings. This social role might refer to a place in the social hierarchy with a label, like a boss or a mother. A role can also be a statement of properties, such as the leader of a group. In CSCL, a role might refer to one’s social role in the knowledge building [36]. Conversely, a network role is defined exactly by the associations of the relations a node possesses, and the role might not have a simple linguistic label. By counting the roles of the nodes, it is possible to examine the structure of a network and the actual patterns of online communication, and not just the centrality of a position. Use of network roles could therefore improve currently used network analysis methods based on centrality measures.
1.2. Research Questions
The aim of our research was to develop novel network analysis methods for education research. In this study, we present a refined social network analysis method based on network roles instead of the more common centrality measures. We also introduce a method to collect and explore the structure of students’ background knowledge. Here, we separate background knowledge to be more general knowledge of a subject rather than specific prior knowledge of a concept.
We developed these methods in the context of a blended university course about science history for pre-service science teachers. Consequently, we used these developed methods in an exploratory case study to investigate if the structure of students’ background knowledge affected the structure of the online discussions they conduct.
Our research questions were:
- What are the network role counts for students in online discussions of a blended university course?
- What are the structural similarities between each student’s background knowledge and the aggregated body of knowledge when collected and analyzed with the new method introduced in this paper?
- Is there a significant relationship between the structural measures of background knowledge and online discussions in a blended university course?
2. Materials and Methods
Data for this study were collected from a blended university course for pre-service science teachers (n = 11). The topic of the course was history of physics, and the course is part of the mandatory studies for physics teachers. The course was divided into seven weeks—an introductory week and six weeks with consecutive time periods under investigation. These time periods constituted a time span of roughly 350 years of science history from 1572 to 1928. Each time period was chosen so that they would represent historical themes. The themes and the time spans are shown in Table 1.
Students were given weekly exercises that started with contextualizing and temporalizing the historical knowledge by producing 12 associative semantic chains with short explanations of the associations, using Wikipedia as the main resource. Each chain consisted of a main concept and four associations. An example of one semantic chain and explanation is shown below.
Isaac Newton [Laws of Mechanics, Falling Apple Story, Robert Hooke, Law of Gravity]
Isaac Newton was an English scholar and philosopher. He wrote Philosophiae Naturalis Principia Mathematica, where he published three laws of mechanics—that is, Newton’s laws of motion. The first law was the law of inertia, the second law was the basic law of dynamics, and the third law was force and counter-force. In the book, the general law of gravity is also presented. It is believed that Isaac Newton was inspired to investigate gravity when he saw an apple in the garden falling to the ground. He was also in correspondence with Robert Hooke, from whom Newton heard the hypothesis of the sun’s attraction, which is inversely proportional to the square of the distance. This led Newton to investigate the matter, and eventually got his theory published.
The contextualizing exercises formed the basis for a face-to-face discussion of the importance and the meaning of the themes and viewpoints for the time period. The themes and the viewpoint were connected to an article about the development of some physics concepts in history that the students were to study more thoroughly during the week. After reading the article, the students conducted an asynchronous online discussion that was pre-structured by guiding questions, resulting in four discussion threads each week. The articles and the guiding questions are shown in Appendix A. The students were instructed to answer the guiding questions and then to comment on each other’s answers. Students were encouraged to continue the dialogue after the initial comments. Both the associative semantic chains with explanations and the online discussion were graded during the course. The grades were used to validate the appropriateness of the data used in this study.
The semantic chains were used to evaluate students’ background knowledge through similarity analysis. Likewise, students’ participation in the online discussions were assessed by calculating the network-based roles in the discussions. The results of the two analyses were then used for correlation estimates.
2.1. Role Analysis of Online Discussion
The weekly online discussions resulted in a set of six log-files. Python-script was used to parse the discussions from the log-files for generating a network consisting of students as nodes and directed edges representing the communication between students—that is, who sent a message to whom during the discussion. Now, the interaction patterns could be analyzed as roles in the network.
The network roles are defined for triads, and the triadic census is the count of the various types of triads in the network [30]. A triad is a sub-graph of three nodes, that is, a subset of three actors. The sub-graphs can be induced by containing all original edges, or the sub-graphs can be partial. The sub-graph patterns that seem to occur more frequently in natural networks than in a randomized network are called network motifs, and these motifs are considered the building blocks of networks [37,38]. A node’s role can be defined as its relational position in a triadic motif.
McDonnell et al. [39] presented a method to compute roles in a directed network based on triadic motif-role fingerprints. Directed networks have 30 different types of motif-role fingerprints in 13 different motifs. The motif-roles are grouped into nine distinct roles. The motif-role fingerprints, motifs, and roles are shown in Table 2. These roles can be either structural or functional roles that correspond to a network’s induced and partial sub-graphs. Basically, the structural roles are the building blocks of the network, and the functional roles are all possible patterns for edges in a network. For example, in a neural network, the synaptic connections form the structural roles, but the functional roles describe all possible synaptic activation patterns. In an online discussion, the structural roles represent the actual structure of the discussion, and the functional roles represent all possible communications which the individuals had or could have had during the discussions. The functional roles could also be interpreted as the possible social relationships between the individuals conducting the discussion.
Each node can have only one structural role in a triad, but up to three functional roles. For example, if a node has the structural role of relay, it additionally has the functional roles of 1-sink and 1-source. In an online discussion, 1-sink corresponds with receiving a message, and 1-source with sending a message. In a highly connected network, all nodes are part of multiple motifs, and therefore also have multiple structural and functional roles.
In addition to roles and motif-roles, Table 2 shows all the equations to calculate the number of functional role-motifs for each node from a network’s adjacency matrix. The matrix (30:N) contains all functional motif-role fingerprints, with the ith column corresponding to the motif-roles of the node i. From , it is possible to obtain the structural motif-roles fingerprint matrix with the conversion matrix representing the relations between the structural and the functional motif-roles (see Equation (2) in [39]). To obtain the counts of the nine roles, we simply summed up the motif-role counts related to each role presented by the rows in Table 2 and got matrix or of size (9:N).
A network with N nodes has possible triads, and therefore, the number of roles a node can play increases with the size of the network. For a complete graph, that is, a fully connected network, each node is a part of all triads. Additionally, each triad consists of of the nodes in the network, and the sum:
yields the number of complete triads a node is part of in a complete graph. For a triad with three reciprocal edges (complete 3-graph), the maximum functional roles for a node are:
Using this information, it is possible to calculate the normalized role counts by element-wise (Hadamard) division:
Now we have a functional role count, or the role census, that is independent of the size of the network, and each role count has a value between . This normalized role census was counted for each student in all six discussions and visualized with heat maps. The functional role with the highest count was noted for each student in each discussion, as it represents the main role or action of the student in that discussion. We also counted the average role count for each role in each discussion and used heat maps to represent functional roles around that average. This visualization was performed to obtain another viewpoint of the difference of the roles between the students. Additionally, a structural role matrix was produced from and summed for . These nine structural roles were presented with heat maps as well.
2.2. Structural Analysis of Background Knowledge
The structure of students’ background knowledge was analysed in the form of networks which were generated from the associative semantic chains made by students. The semantic chains made by the students were formed in pair-wise connections, for example, [I.Newton—Newton’s law of gravity] or [I.Newton—Heliocentrism]. Each concept was a node, and all pairwise associations represented edges between the nodes. These networks were constructed for each student for each time period consisting of approximately 40 to 50 pairwise connections. Additionally, one network to represent the overall body of the background knowledge was aggregated from all students’ answers. Finally, aggregated networks across all time periods for each student, as well as overall, were generated. The background knowledge can be considered to represent the shared consensus of relevant topics among the students, and none of those pair-wise connections were assessed for their relevance or accuracy.
Katz and degree centralities (number of edges attached to node) were computed for the network, representing the overall body of background knowledge. Katz centrality [40,41] is based on counting paths of different lengths from one node to other nodes, and it contains a damping factor for these paths, which allows us to tune how extensive an amount of the network is explored. Hence, Katz centrality is suitable in finding which nodes are the most relevant in contributing to overall global connectivity, and in this way, the most relevant concepts of the background knowledge. Katz centrality can be expressed as a column vector [40]:
where is the ith power of the adjacency matrix describing the number of i length paths in the network, and damping factor sets how much paths of different lengths are weighted. In this study, was chosen to be between to times the largest eigenvalue of each given network so that the sum converges, and the global connectivity of paths contributes to Katz centrality.
The overall background knowledge for each period was formed by aggregating all students’ answers, and can be considered to represent the shared consensus of relevant topics among students. The Jaccard similarity coefficient [42] was used to assess the knowledge that each individual student managed to extract from Wikipedia during these weekly exercises before the online discussion, and how this knowledge compared to other students’ knowledge. Each student’s contribution to this background knowledge can be expressed as a sub-graph of the overall network, and this contribution could now be evaluated quantitatively using the Jaccard similarity coefficient and Katz centrality; the higher the similarity of a given student’s network to the aggregated network, the higher the student’s contribution to the overall body of the background knowledge, and the greater the potential for a beneficial online discussion. For each student’s contribution, Katz centrality was used to find the Jaccard similarity coefficient:
where is the sum of Katz centrality values of those nodes that appear in one student’s pair-wise connections, and is the overall sum of Katz centrality values of a given network.
2.3. Correlation Analysis
Now we have a structural measure for both the students’ background knowledge and the online discussion. To evaluate the statistical correlation between the two measurements, we chose to use Spearman’s rank correlation coefficient and Kendall’s tau-b coefficient. These non-parametric measures were chosen as the data we had was non-linear and there was no assumption of distribution. Both coefficients were computed for each functional role in order not to miss any possible dependencies within the data. Correlation analysis with structural roles is unsuitable as, in many instances, there are only a few non-zero values for structural roles. For example, in a highly connected network, some node could have only the ninth role. Additionally, we exclude insignificant and missing similarities from the correlation analysis.
3. Results
The results consist of the role counts from each weekly discussion and the similarities as a measure of background knowledge. The student K contributed to three discussions, but made insignificant contributions to the background knowledge exercise during the course and eventually dropped out. Therefore, this student is not part of the similarity results, but is included in the network roles of the first three periods. All in all, there were 984 messages in the discussions, and on average, each student sent 4.9 messages to the discussion threads. On average, students received 87 % and 94 % of maximum points from the posted messages and the associative semantic chains, respectively.
3.1. Roles
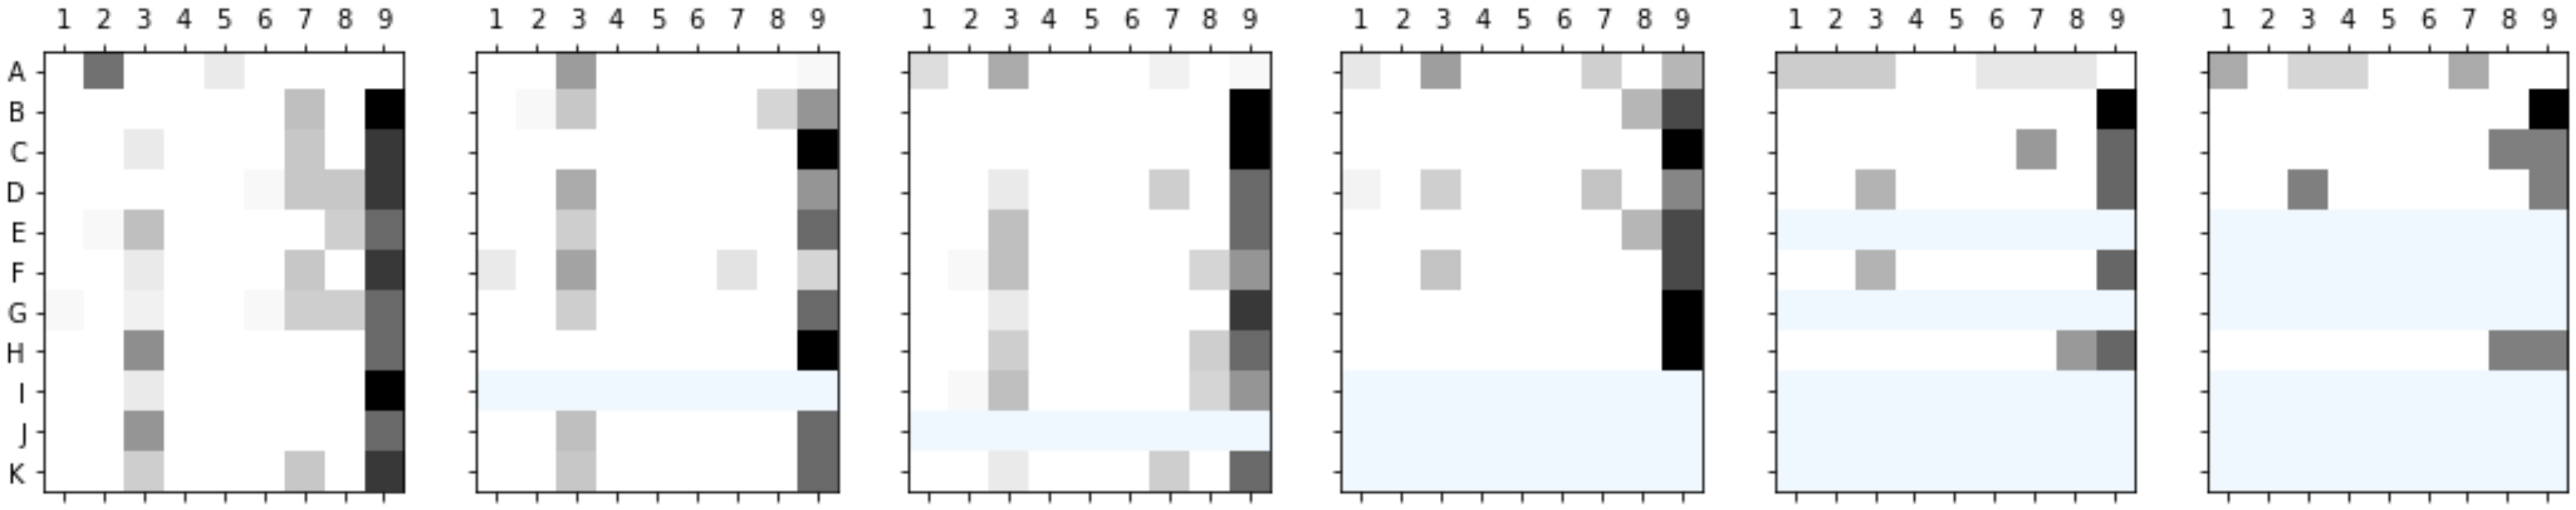
The networks generated from the students’ online discussions are visualized in Figure 1. The functional and structural roles were computed for each student from these networks and summed to obtain the nine distinct roles. The structural role counts for each time period are represented as heat maps in Figure 2.
The functional role census, that is, the number of each role was counted, and the counts normalized from the discussion networks. Table 3 shows the main role each student played in the discussions. Here, the main role is the role that had the highest value in the role census. Due to the nature of the functional roles, it was possible to have the same number of different roles. In these cases, the highest of the nine roles was chosen, as it better represents the main role.
3.2. Similarities
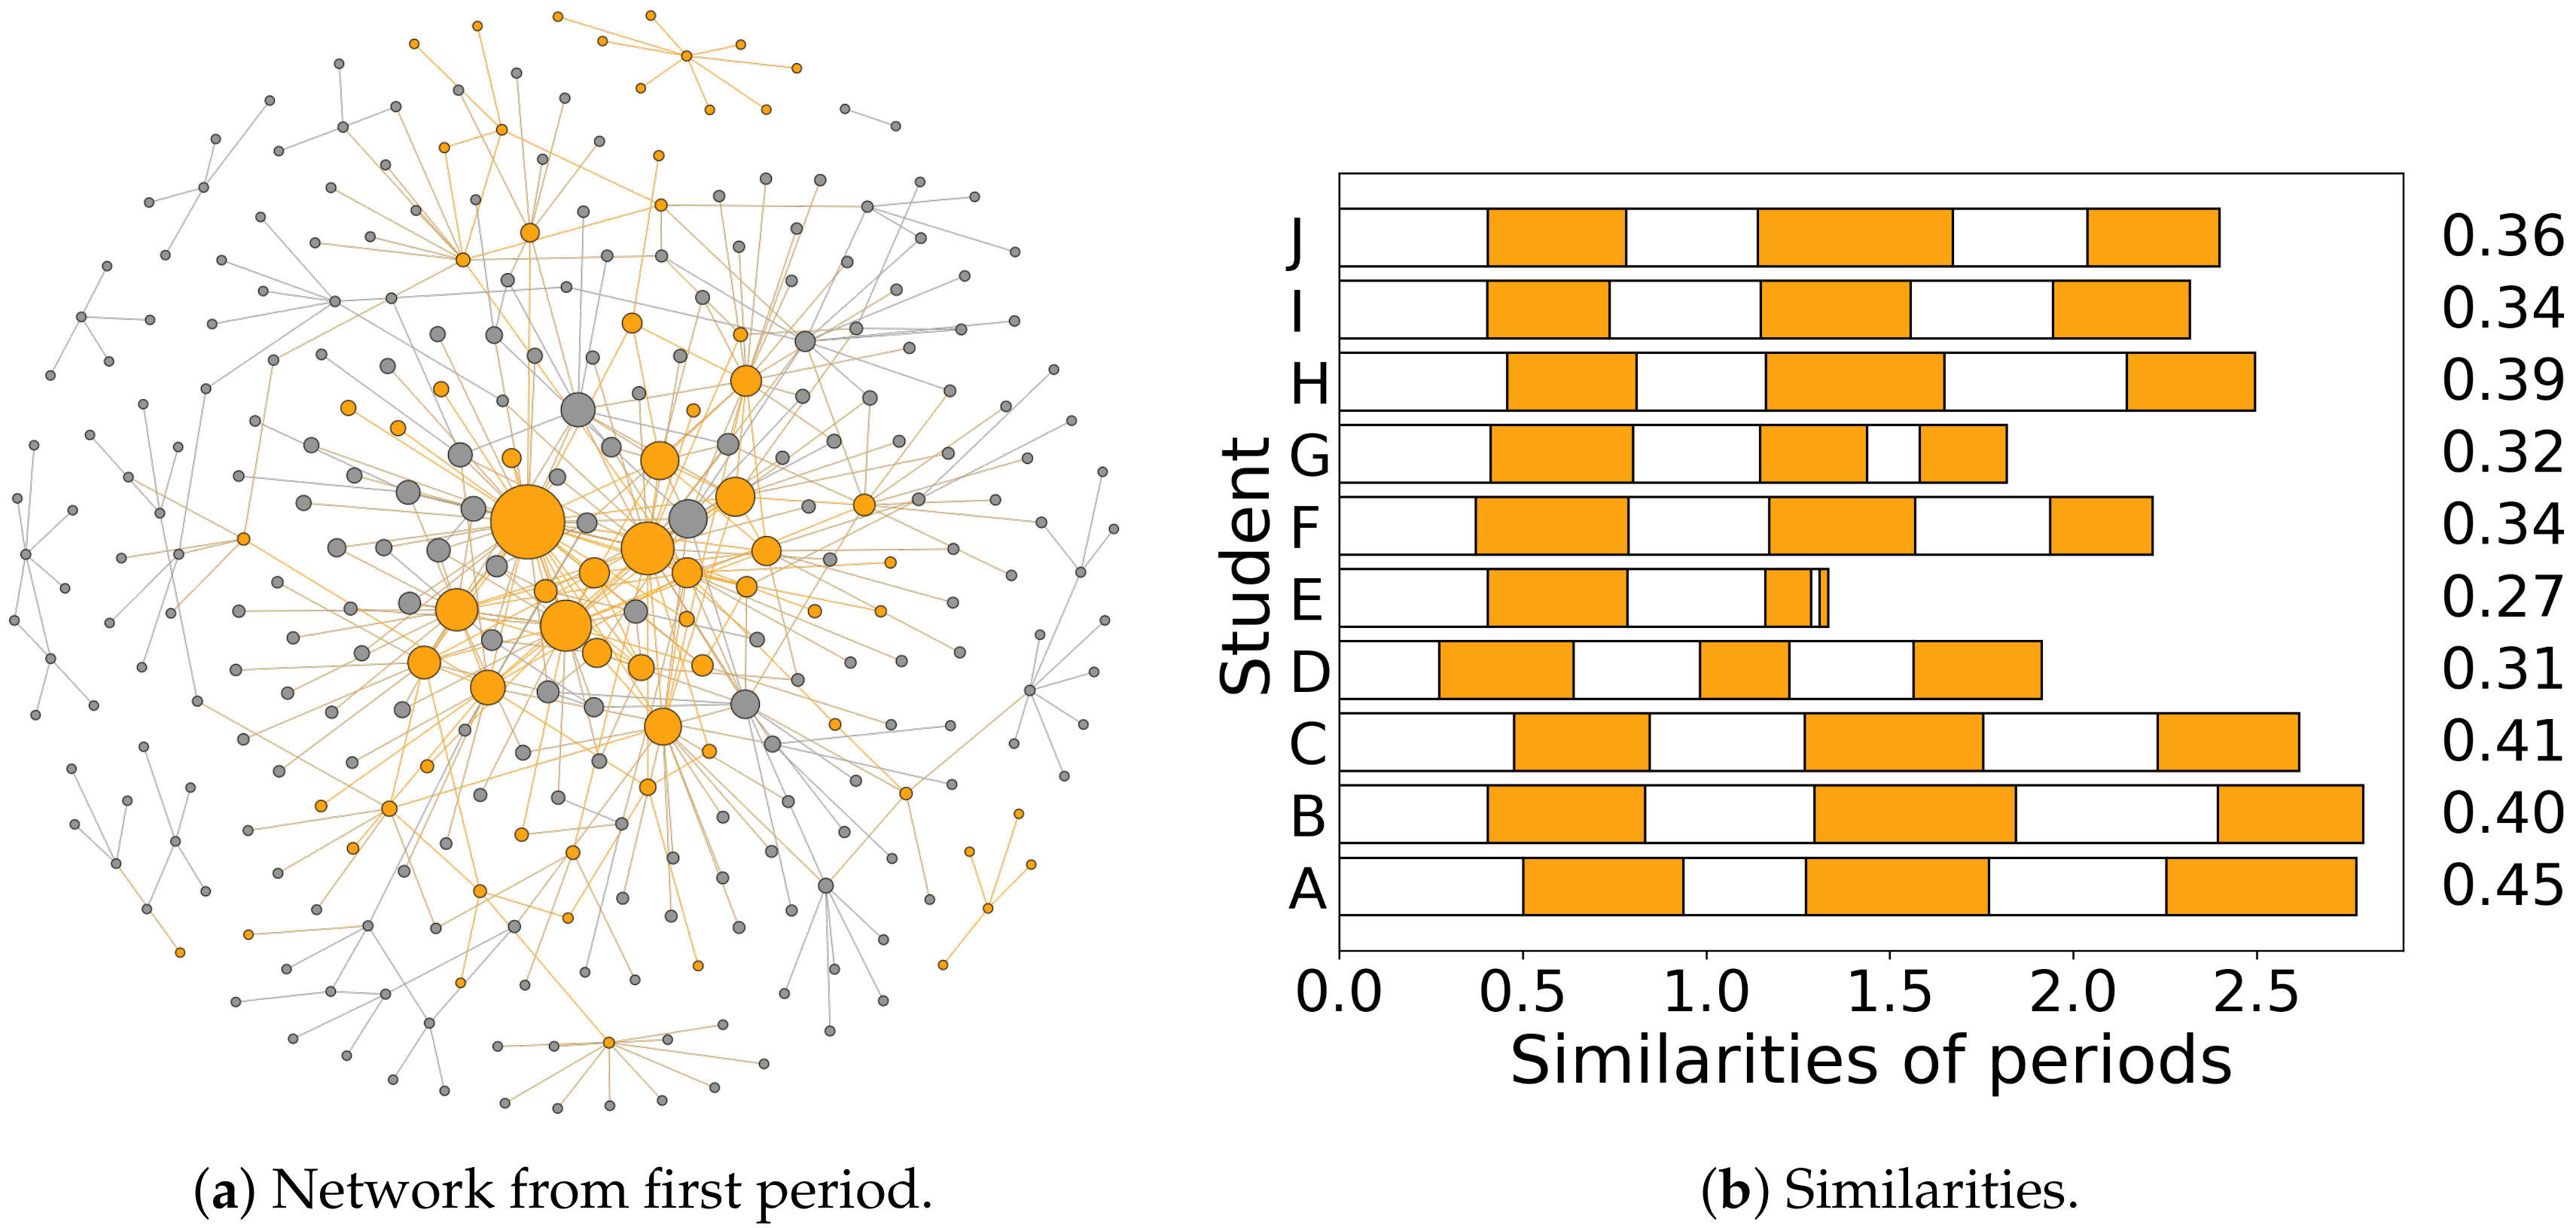
An example of a network generated from students’ associative semantic chains is shown in Figure 5a, with one student’s contribution highlighted. In the example, the more central (and thus larger) nodes include Isaac Newton, Gravity, Johannes Kepler, and Heliocentrism. Less central concepts, seen at the perimeter of the visualization, included the Reformation, Nicolaus Copernicus, and Christiaan Huygens.
The similarity of the students’ network to the aggregated network are shown in Figure 5b. The similarities for the periods range from 0.02 to 0.55, with an average of 0.38.
3.3. Correlation of Similarities and Roles
4. Discussion
We used novel network analysis methods to analyze two different exercise types during a blended university course. The first exercise was related to the background knowledge of students, and the second exercise was an asynchronous online discussion. The network analysis resulted in structural measures of students’ background knowledge and online discussion. This allowed us to compare these two measures to investigate any possible connection between background knowledge and participation in online discussion.
4.1. Role Analysis
From the structural roles, we can see that the overall structure of the discussion consists of reciprocal roles, where most edges within the triads are reciprocally connected. The only exception is student A, who has fewer roles overall, and only some of which are reciprocal. The reciprocal roles indicate that most of the communication happened back and forth between the students. This tendency also increases as the number of participants decreases. This most likely resulted from having fewer people to respond to for the required points. On the other hand, even with all participants, the full group did not seem to form any distinct sub-groups or isolates that could happen with more than four participants [20].
The lack of isolates can be seen even more clearly from the functional roles. If such groups had formed, there would be more role counts under central values, that is, heat maps should show more blue. Even considering average roles, this is not visible. Overall, the functional role counts offer more information about the structure and dynamics of the discussions than the structural roles. Here, we see the same lack of participation on student A’s part, but it is even more evident. We can also see that most students have high role counts, but the activity of all participants is not consistent across all periods.
Heat maps with the mean role counts offer a similar view of the discussion activities, but do not allow comparisons between different discussions with different numbers of participants. For example, week four clearly has the highest role counts, and therefore also activity in the discussion, as more messages between participants increases the number of role counts they have. In future, this averaging of the role counts might not be needed.
Interpreting the heat maps requires some experience and understanding of the functional roles. The table with the main role for each student is more straightforward to interpret, and it is possible to see some consistency in the roles for each student. Roles 1-sink, 1 source, and 1-recip relate to dyadic (i.e., between two nodes) relationships, whereas the other roles connect to triadic relationships. Students A, D, E, F, G, J, and K mainly had these dyadic relations with others. For example, in an agent-based model [20,43], small groups should form these reciprocal dyads when sensitivity to the competitive comparison increases. The three students, B, C, and H instead formed more egalitarian triads and might have had lower sensitivity for competition. If the decision of whom to communicate with depends on some social feature, the method shown here can be used to investigate those social processes or structures.
The weekly discussions were structured and fast-paced, with each taking approximately 2 h with four discussion threads under the guiding questions. This might result in unnatural discussion patterns, and thus influence the role census, as students do not have enough time to ponder and reflect on each message and choose whom to respond to. Instead, students might just take care to post the appropriate number of messages for points. Hiltz and Goldman [44], who have defined the asynchronous learning network, note that for beneficial discussions, the students should have the opportunity to read and respond at the time of their choosing. Research also shows that the quality of students’ posts increases if they have time to read and re-read each other’s messages [45]. This would mean, for example, the discussion spanning the whole week with students interacting truly asynchronously when most convenient, individually. Unfortunately, such discussions are not feasible in short and content-heavy university courses with several weekly exercises. Additionally, administrative reasons might limit the possibilities for student exercises without clearly described schedules.
Stahl [5] suggests that online discussion might have more complex implicit structures than what the connection of notes or messages reveal. This refers to the real-world possibility that whom to reply to is affected by reading multiple messages and not just by the one message being replied to. In practise, this could be accounted for by using the meta data from the online forum software. This meta data usually shows some additional information about what actions were performed beyond just posting a message. Unfortunately, the meta data from the software used to facilitate the online discussions did not show what messages each student had opened or read.
Even with the above-mentioned limitations, this study demonstrates that network analysis based on network roles, as presented by McDonnell et al. [39] can be used to analyse participation in online discussion. The roles show not only the amount of participation or who has a central position, but reveals what kind of connections, that is, roles, students tend to form with each other. These roles provide a useful new method for social network analysis, and anyone planning on using SNA in CSCL or elsewhere should consider this method. It might be more suitable than the commonly-used methods based on centrality measures, especially if the aim is to study the dynamics of a social group.
4.2. Similarity Analysis
Results from similarity analysis show that, for the first three periods, the variation in similarities between the students seems rather small. Afterwards, a few students have clearly smaller similarities, but they are also not participating in the online discussions. This probably indicates lack of participation overall. Even with the small variation, these similarities are able to provide a broad estimate of students’ background knowledge relative to each other. Cumulatively, student B had the highest similarity, but for the aggregated network, student A had the highest similarity. Both students had good overall background knowledge, but they exhibit differences in the individual periods.
Overall, this similarity analysis is a novel approach to find a quantitative measure of how much shared background knowledge each student has compared to other students. In this type of analysis, the results will depend on the centrality measures used. Here, Katz-centrality was chosen, as previous research has shown that this method works well with Katz-centrality to reliably investigate student knowledge landscapes [46].
In this analysis, Jaccard similarity was used to compute the fraction of background knowledge each student had. This similarity measure, however, is not the only way to compare different networks, and there is plenty of room to improve this analysis. For example, Rényi entropy of networks can be used to compute generalized q-Jensen-Shannon divergence between two networks (see, e.g., [47]). In this way, it is possible to determine how much new information each student’s contribution brings to the background knowledge.
4.3. Correlation Analysis
Some of the correlations between the similarities and the roles seem to be statistically significant. However, if we remove student A’s contributions, most of the significance disappears. Student A can be regarded as an outlier in the data, as his or her role counts differ drastically from the normalized and averaged counts. This is a result of lack of participation in the online discussions. On this basis, we were unable to find any meaningful correlation between any role, and hence, the discussion activity, as well as the background knowledge.
One possible reason for the missing correlation could be the small number of participants. Only 10 students completed the course, and only half participated in each discussion, resulting in even fewer data points. Each week’s discussion was divided under the guiding questions, but there was no correlation even with these distinct discussion threads. Furthermore, functional roles should capture all relevant information from the aggregated discussions. A more likely reason for not seeing a correlation here is that there are simply no straightforward correlations between these two structural measures. The reasons for participation are probably numerous and varied. For example, in [25], background knowledge is one part of a student’s background affecting online discussions. Simple two-variable analysis is unable to find possible connections and reasons for online activity. Instead, multivariate analysis would be needed with much larger and varied data sets.
4.4. Limitations and Implications
Relying only on quantitative network methods has some limitations. It would be possible to extract more information from both the discussions and the background knowledge with qualitative methods, such as content analysis, but our focus is on developing network analysis methods. This would allow us to readily analyze larger data sets in the future without time-consuming and resource-heavy content analysis.
Without content analysis, it could be argued that the associative connections made by students or the online discussions they conducted are not meaningful. These exercises were graded, and on average, the students received high scores on both exercises. This indicates that the student contributions in both exercises were task-specific. With online discussions, this is in line with previous research results [8].
One possible alternative quantitative analysis for the online discussion would have been to use number of messages, but as Heo et al. [16] noted, the number of messages do not equal quality. Furthermore, the instructions given to the students did not specify a set number of messages to receive the maximum points per thread, but in practice, six messages was enough to get the points. The average message per students being 4.9 shows that not much extra discussion was had. Thus, it was reasonable to use a method based on network analysis. The method could be improved with temporal networks [48] as online discussion is a temporal process by nature. Preliminary investigation with time slices did not seem promising. Temporal analysis should most likely be done with temporal motifs [49]. It would need further theoretical work to temporalize the network roles, but it would only need to be done once.
The constancy in the roles implies some student-related factor which determines the role, although on the basis of the results presented here, it is not likely to be the background knowledge of the student. Small similarities with a missing discussion for student E are probably explainable by lack of participation with the exercises, which might arise from motivation or scheduling problems. Student A’s high similarity and low role counts could be explained by assuming that a student who knows material well does not really benefit from discussions and does not invest effort in it. This seems to indicate that the roles, and the quality, of the discussions are not affected by the prior understanding of the context. Thus, the plausible hypothesis that intensity or role in the discussion could be determined by the background knowledge is untenable. Reasons for the distinct roles that different students play in the discussions must be sought elsewhere than from the structure and the extent of the background knowledge.
If there is no correlation between background knowledge and online discussion, it would mean that there is no need to develop students’ understanding of the relevant concepts before conducting online discussions, or that these activities can be done independently of each other. On the other hand, good background knowledge could diminish the significance of online discussions. How and when online discussions are implemented should thus be considered carefully so that they actually build on and improve students’ knowledge.
The next question we might ask is whether the roles are constant in longer discussions and if they correlate with other student contributions. The present study demonstrates that network analysis methods can be used to study blended learning, and we now have suitable tools and methods for a more extensive study. Both methods shown here could also be further improved with theoretical work relating to networks.
5. Conclusions
In this study, we set out to develop network analysis-based methods to investigate structural measures of students’ background knowledge and the structure of online discussion. For the background knowledge, the network was based on a student exercise with association chains of relevant concepts. The social network analysis of the online discussion was based on network roles, instead of the more common centrality measures. These methods were deemed useful and applicable for larger research projects, but both methods also have room for further development.
The methods developed allowed us to explore the possible connections between background knowledge and participation in online discussion. This connection was something we identified as something that had not been addressed before in CSCL literature. According to our results, there seems to be some student-related factors affecting the roles in the discussion, but on the basis of this exploratory study, we conclude that the student’s background knowledge is not a strong or likely factor deciding their participation in the discussions. This factor could be internal or external motivation related to studying in general or some social aspect, like peer appreciation. The possible lack of connections between the background knowledge and the roles in the online discussions could imply that it is possible to build background knowledge and conduct online discussions independently of each other. Another option would be to utilize only one of the two activities. In differently-organized discussions and with more students, the results might be different.
Author Contributions
Investigation of background knowledge, H.L.; investigation of online discussions M.T.; writing—original draft preparation, M.T.; writing—review and editing, M.T. and H.L. All authors have read and agreed to the published version of the manuscript.
Funding
This research received no external funding
Conflicts of Interest
The authors declare no conflict of interest.
Appendix A. The Guiding Questions Used During the Online Discussions
| 1st Period |
| Time span: 1572–1704 Theme: Scientific revolution |
| Article: L. Rosenfeld (1965), Newton and the law of gravitation [50] |
Guiding questions:
|
| 2nd Period |
| Time span: 1704–1789 Theme: Enlightenment and the science of enlightenment |
| Article: E. McMullin (2002), The Origins of the Field Concept in Physics [51] |
Guiding questions:
|
| 3rd Period |
| Time span: 1789–1848 Industrialisation and liberal educational ideal |
| Article: D. Sherry (2011), Thermoscopes, thermometers, and the foundations of measurement [52] |
Guiding questions:
|
| 4th Period |
| Time span: 1848–1900 Theme: Technologizing society and its science |
| Article: O. Darrigol (1999), Baconian Bees in the Electromagnetic Fields: Experimenter-Theorists In Nineteenth-Century Electrodynamics [53] |
Guiding questions:
|
| 5th Period |
| Time span: 1900–1914 Theme: Modern science and technologicalization I |
| Article: H. Kragh (2011), Resisting the Bohr Atom: The Early British Opposition [54] |
Guiding questions:
|
| 6th Period |
| Time span: 1914–1928 Theme: Modern science and technologicalization II |
| Article: K. Camilleri (2006), Heisenberg and the wave-particle duality [55] |
Guiding questions:
|
References
- Dillenbourg, P.; Eurelings, A.; Hakkarainen, K. Introduction. In European Perspectives on Computer-Supported Collaborative Learning; Dillenbourg, P., Eurelings, A., Hakkarainen, K., Eds.; University of Maastricht: Maastricht, The Netherlands, 2001. [Google Scholar]
- Stahl, G.; Koschmann, T.; Daniel, S. Computer-Supported Collaborative Learning. In The Cambridge Handbook of the Learning Sciences; Sawyer, R.K., Ed.; Cambridge University Press: Oxford, UK, 2014; Chapter 24; pp. 479–500. [Google Scholar]
- Scardamalia, M.; Bereiter, C. Computer Support for Knowledge-Building Communities. J. Learn. Sci. 1994, 3, 265–283. [Google Scholar] [CrossRef]
- Scardamalia, M.; Bereiter, C. Knowledge Building and Knowledge Creation. In The Cambridge Handbook of the Learning Sciences; Sawyer, R.K., Ed.; Cambridge University Press: Oxford, UK, 2014; Chapter 20; pp. 397–417. [Google Scholar]
- Stahl, G.K. Group Cognition: Computer Support for Building Collaborative Knowledge; Acting with Technology; MIT Press: Cambridge, MA, USA, 2006; p. 510. [Google Scholar]
- Pena-Shaffa, J.B.; Nicholls, C. Analyzing student interactions and meaning construction in computer bulletin board discussions. Comput. Educ. 2004, 42, 243–265. [Google Scholar] [CrossRef]
- Martínez, A.; Dimitriadis, Y.; Gómez-Sánchez, E.; Rubia-Avi, B.; Jorrín-Abellán, I.; Marcos, J.A. Studying participation networks in collaboration using mixed methods. Int. J. Comput. Support. Collab. Learn. 2006, 1, 383–408. [Google Scholar] [CrossRef]
- Schellens, T.; Valcke, M. Collaborative learning in asynchronous discussion groups: What about the impact on cognitive processing? Comput. Hum. Behav. 2005, 21, 957–975. [Google Scholar] [CrossRef]
- Sinha, S.; Rogat, T.K.; Adams-Wiggins, K.R.; Hmelo-Silver, C.E. Collaborative group engagement in a computer-supported inquiry learning environment. Int. J. Comput. Support. Collab. Learn. 2015, 10, 273–307. [Google Scholar] [CrossRef]
- Järvelä, S.; Malmberg, J.; Koivuniemi, M. Recognizing socially shared regulation by using the temporal sequences of online chat and logs in CSCL. Learn. Instruct. 2016, 42, 1–11. [Google Scholar] [CrossRef]
- Järvelä, S.; Järvenoja, H.; Malmberg, J. Capturing the dynamic and cyclical nature of regulation: Methodological Progress in understanding socially shared regulation in learning. Int. J. Comput. Support. Collab. Learn. 2019, 14, 425–441. [Google Scholar] [CrossRef] [Green Version]
- Noroozi, O.; Teasley, S.D.; Biemans, H.J.; Weinberger, A.; Mulder, M. Facilitating learning in multidisciplinary groups with transactive CSCL scripts. Int. J. Comput. Support. Collab. Learn. 2013, 8, 189–223. [Google Scholar] [CrossRef]
- Verdú, N.; Sanuy, J. The role of scaffolding in CSCL in general and in specific environments. J. Comput. Assist. Learn. 2014, 30, 337–348. [Google Scholar] [CrossRef] [Green Version]
- Lucas, M.; Gunawardena, C.; Moreira, A. Assessing social construction of knowledge online: A critique of the interaction analysis model. Comput. Hum. Behav. 2014, 30, 574–582. [Google Scholar] [CrossRef]
- Jeong, A.C. The Sequential Analysis of Group Interaction and Critical Thinking in Online. Am. J. Distance Educ. 2003, 17, 25–43. [Google Scholar] [CrossRef]
- Heo, H.; Lim, K.Y.; Kim, Y. Exploratory study on the patterns of online interaction and knowledge co-construction in project-based learning. Comput. Educ. 2010, 55, 1383–1392. [Google Scholar] [CrossRef]
- Wecker, C.; Fischer, F. Where is the evidence? A meta-analysis on the role of argumentation for the acquisition of domain-specific knowledge in computer-supported collaborative learning. Comput. Educ. 2014, 75, 218–228. [Google Scholar] [CrossRef]
- Jeong, H.; Hmelo-Silver, C.E.; Jo, K. Ten years of Computer-Supported Collaborative Learning: A meta-analysis of CSCL in STEM education during 2005–2014. Educ. Res. Rev. 2019, 28, 100284. [Google Scholar] [CrossRef]
- Schellens, T.; Valcke, M. Fostering knowledge construction in university students through asynchronous discussion groups. Comput. Educ. 2006, 46, 349–370. [Google Scholar] [CrossRef]
- Koponen, I.T.; Nousiainen, M. An agent-based model of discourse pattern formation in small groups of competing and cooperating members. J. Artif. Soc. Soc. Simul. 2018, 21. [Google Scholar] [CrossRef] [Green Version]
- Wang, Q.; Woo, H.L.; Zhao, J. Investigating critical thinking and knowledge construction in an interactive learning environment. Interact. Learn. Environ. 2009, 17, 95–104. [Google Scholar] [CrossRef]
- Boelens, R.; De Wever, B.; Voet, M. Four key challenges to the design of blended learning: A systematic literature review. Educ. Res. Rev. 2017, 22, 1–18. [Google Scholar] [CrossRef] [Green Version]
- Eryilmaz, E.; van der Pol, J.; Ryan, T.; Clark, P.M.; Mary, J. Enhancing student knowledge acquisition from online learning conversations. Int. J. Comput. Support. Collab. Learn. 2013, 8, 113–144. [Google Scholar] [CrossRef]
- Engelmann, T.; Hesse, F.W. How digital concept maps about the collaborators’ knowledge and information influence computer-supported collaborative problem solving. Int. J. Comput. Support. Collab. Learn. 2010, 5, 299–319. [Google Scholar] [CrossRef]
- Arvaja, M. Contextual perspective in analysing collaborative knowledge construction of two small groups in web-based discussion. Int. J. Comput. Support. Collab. Learn. 2007, 2, 133–158. [Google Scholar] [CrossRef]
- Marzano, R.J. Building Background Knowledge for Academic Achievement: Research on What Works in Schools; Association for Supervision and Curriculum Development: Alexandria, VA, USA, 2004; p. 217. [Google Scholar]
- Zambrano R., J.; Kirschner, F.; Sweller, J.; Kirschner, P.A. Effects of prior knowledge on collaborative and individual learning. Learn. Instruct. 2019, 63, 101214. [Google Scholar] [CrossRef]
- De Wever, B.; Schellens, T.; Valcke, M.; Van Keer, H. Content analysis schemes to analyze transcripts of online asynchronous discussion groups: A review. Comput. Educ. 2006, 46, 6–28. [Google Scholar] [CrossRef]
- Puntambekar, S.; Erkens, G.; Hmelo-Seilver, C. Introduction. In Analyzing Interactions in CSCSL: Methods, Approaches and Issues; Puntambekar, S., Erkens, G., Hmelo-Seilver, C., Eds.; Springer: New York, NY, USA, 2011. [Google Scholar]
- Wasserman, S. Social Network Analysis: Methods and Applications; Structural Analysis in the Social Sciences; Cambridge University Press: Cambridge, UK, 1994. [Google Scholar]
- De Laat, M.; Lally, V.; Lipponen, L.; Simons, R.J. Investigating patterns of interaction in networked learning and computer-supported collaborative learning: A role for Social Network Analysis. Int. J. Comput. Support. Collab. Learn. 2007, 2, 87–103. [Google Scholar] [CrossRef]
- Smith Risser, H.; Bottoms, S.A. “Newbies” and “Celebrities”: Detecting social roles in an online network of teachers via participation patterns. Int. J. Comput. Support. Collab. Learn. 2014, 9, 433–450. [Google Scholar] [CrossRef]
- Dado, M.; Bodemer, D. A review of methodological applications of social network analysis in computer-supported collaborative learning. Educ. Res. Rev. 2017, 22, 159–180. [Google Scholar] [CrossRef]
- Barabási, A. The network takeover. Nat. Phys. 2011, 8, 14–16. [Google Scholar] [CrossRef]
- Knoke, D.; Yang, S. Social Network Analysis; SAGE Publications, Inc.: Los Angeles, CA, USA; London, UK, 2008. [Google Scholar]
- Cesareni, D.; Cacciamani, S.; Fujita, N. Role taking and knowledge building in a blended university course. Int. J. Comput. Support. Collab. Learn. 2016, 11, 9–39. [Google Scholar] [CrossRef] [Green Version]
- Itzkovitz, S.; Milo, R.; Kashtan, N.; Ziv, G.; Alon, U. Subgraphs in random networks. Phys. Rev. E 2003, 68, 026127. [Google Scholar] [CrossRef] [Green Version]
- Milo, R.; Shen-Orr, S.; Itzkovitz, S.; Kashtan, N.; Chklovskii, D.; Alon, U. Network motifs: Simple building blocks of complex networks. Science 2002, 298, 824–827. [Google Scholar] [CrossRef] [Green Version]
- McDonnell, M.D.; Yaveroğlu, Ö.N.; Schmerl, B.A.; Iannella, N.; Ward, L.M. Motif-Role-Fingerprints: The Building- Blocks of Motifs, Clustering-Coefficients and Transitivities in Directed Networks. PLoS ONE 2014, 9, e114503. [Google Scholar] [CrossRef] [PubMed] [Green Version]
- Estrada, E. The Structure of Complex Networks: Theory and Applications; Oxford University Press: Oxford, UK, 2012. [Google Scholar]
- Katz, L. A new status index derived from sociometric analysis. Psychometrika 1953, 18, 39–43. [Google Scholar] [CrossRef]
- Jaccard, P. The Distribution of the Flora in the Alpine Zone. 1. N. Phytol. 1912, 11, 37–50. [Google Scholar] [CrossRef]
- Koponen, I.T.; Nousiainen, M. Formation of reciprocal appreciation patterns in small groups: An agent-based model. Complex Adapt. Syst. Model. 2016, 4, 24. [Google Scholar] [CrossRef] [Green Version]
- Hiltz, S.R.; Goldman, R. What Are Asynchronous Learning Networks. In Learning Together Online, Research in Asynchronous Learning Networks; Hiltz, S.R., Goldman, R., Eds.; Lawrene Erlbaum Associates: Mahwah, NJ, USA, 2005. [Google Scholar]
- Wise, A.F.; Hausknecht, S.N.; Zhao, Y. Attending to others’ posts in asynchronous discussions: Learners’ online “listening” and its relationship to speaking. Int. J. Comput. Support. Collab. Learn. 2014, 9, 185–209. [Google Scholar] [CrossRef]
- Lommi, H.; Koponen, I.T. Network cartography of university students’ knowledge landscapes about the history of science: Landmarks and thematic communities. Appl. Netw. Sci. 2019, 4. [Google Scholar] [CrossRef]
- De Domenico, M.; Biamonte, J. Spectral Entropies as Information-Theoretic Tools for Complex Network Comparison. Phys. Rev. X 2016, 6, 041062. [Google Scholar] [CrossRef] [Green Version]
- Holme, P.; Saramäki, J. Temporal networks. Phys. Rep. 2012, 519, 97–125. [Google Scholar] [CrossRef] [Green Version]
- Kovanen, L.; Karsai, M.; Kaski, K.; Kertész, J.; Saramäki, J. Temporal motifs. In Temporal Networks; Springer: Berlin/Heidelberg, Germany, 2013; pp. 119–133. [Google Scholar]
- Rosenfeld, L. Newton and the Law of Gravitation. Arch. Hist. Exact Sci. 1965, 2, 365–386. [Google Scholar] [CrossRef]
- McMullin, E. The Origins of the Field Concept in Physics. Phys. Perspect. 2002, 4, 13–39. [Google Scholar] [CrossRef]
- Sherry, D. Thermoscopes, thermometers, and the foundations of measurement. Stud. Hist. Philos. Sci. Part A 2011, 42, 509–524. [Google Scholar] [CrossRef]
- Darrigol, O. Baconian bees in the electromagnetic fields: Experimenter-theorists in nineteenth-century electrodynamics. Stud. Hist. Philos. Sci. Part B Stud. Hist. Philos. Mod. Phys. 1999, 30, 307–345. [Google Scholar] [CrossRef]
- Kragh, H. Resisting the Bohr Atom: The Early British Opposition. Phys. Perspect. 2011, 13, 4–35. [Google Scholar] [CrossRef]
- Camilleri, K. Heisenberg and the wave-particle duality. Stud. Hist. Philos. Sci. Part B Stud. Hist. Philos. Mod. Phys. 2006, 37, 298–315. [Google Scholar] [CrossRef]
Figure 1.
Graphs from the weekly discussions. Students A to K (clockwise, starting from the top and edges) represent the responses, that is, who responded to whom. If a student did not participate, only an outline of the node is shown.
Figure 1.
Graphs from the weekly discussions. Students A to K (clockwise, starting from the top and edges) represent the responses, that is, who responded to whom. If a student did not participate, only an outline of the node is shown.

Figure 2.
Heat maps representing structural roles, where darkness corresponds to the number of roles so that white indicates zero roles. One black cell means that the student had only that structural role in the discussions. Light blue indicates that the student did not participate in the discussion.

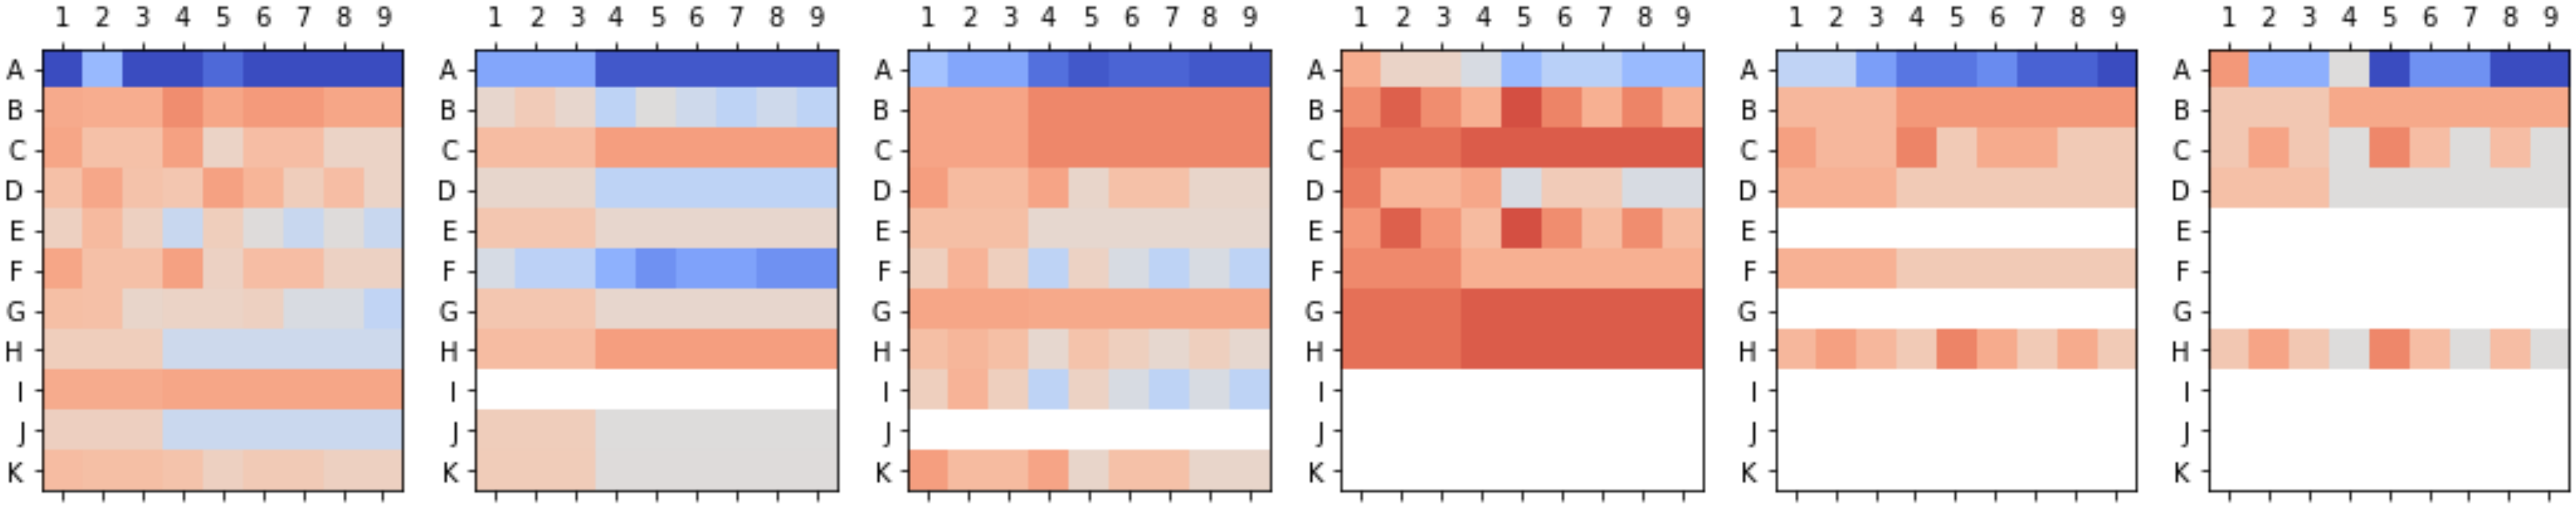
Figure 3.
Diverging heat maps representing the normalized functional roles. The blue and the red represent no roles and maximum possible roles, respectively. White indicates that the student did not participate in the discussion.
Figure 3.
Diverging heat maps representing the normalized functional roles. The blue and the red represent no roles and maximum possible roles, respectively. White indicates that the student did not participate in the discussion.

Figure 4.
Diverging heat maps representing the roles around the average. The blue and the red represent roles below and over the average, respectively. White indicates that the student did not participate in the discussion.
Figure 4.
Diverging heat maps representing the roles around the average. The blue and the red represent roles below and over the average, respectively. White indicates that the student did not participate in the discussion.

Figure 5.
Example of a network generated from students’ word association chains, with one student’s contribution highlighted. Katz similarities for each student per time period, and the similarity to the aggregated network when periods are accumulated.
Figure 5.
Example of a network generated from students’ word association chains, with one student’s contribution highlighted. Katz similarities for each student per time period, and the similarity to the aggregated network when periods are accumulated.


Table 1.
Time periods and themes under the weekly investigations.
| Period | Time Span | Theme |
|---|---|---|
| 1st | 1572–1704 | Scientific revolution |
| 2nd | 1704–1789 | Enlightenment and the science of enlightenment |
| 3rd | 1789–1848 | Industrialization and liberal educational ideal |
| 4th | 1848–1900 | Technologizing society and its science |
| 5th | 1900–1914 | Modern science and technologicalization I |
| 6th | 1914–1928 | Modern science and technologicalization II |
Table 2.
Adapted from [39]. Formulae for counting the functional three-node motif-role fingerprints from adjacency matrix A. The nine roles are depicted in the first column, and the rows show the related motif-role fingerprints (). shows which motif each role-motif is a part of. 1 is a unit column matrix, I is a identity matrix, is the matrix of reciprocal edges, and ∘ denotes a Hadamard product.
| Role | Motif-Roles | |||||||
|---|---|---|---|---|---|---|---|---|
 | r = 1 m = 1 |  | r = 2 m = 2 |  | r = 3 m = 3 |  | ||
| 1-sink | ||||||||
 | r = 4 m = 2 |  | r = 5 m = 4 |  | r = 6 m = 7 |  | ||
| 1-source | ||||||||
 | r = 7 m = 3 |  | r = 8 m = 7 |  | r = 9 m = 8 |  | ||
| 1-recip | ||||||||
 | r = 10 m = 4 |  | r = 11 m = 5 |  | r = 12 m = 6 |  | ||
| 2-sink | ||||||||
 | r = 13 m = 1 |  | r = 14 m = 5 |  | r = 15 m = 11 |  | ||
| 2-source | ||||||||
 | r = 16 m = 2 |  | r = 17 m = 5 |  | r = 18 m = 9 |  | r = 19 m = 10 |  |
| relay | ||||||||
 | r = 20 m = 7 |  | r = 21 m = 10 |  | r = 22 m = 11 |  | r = 23 m = 12 |  |
| relay & sink | ||||||||
 | r = 24 m = 3 |  | r = 25 m = 6 |  | r = 26 m = 10 |  | r = 27 m = 12 |  |
| relay & source | ||||||||
 | r = 28 m = 8 |  | r = 29 m = 12 |  | r = 30 m = 13 |  | ||
| all | ||||||||
Table 3.
Main functional role each student played in the weekly discussion.
| Student | 1st Period | 2nd Period | 3rd Period | 4th Period | 5th Period | 6th Period |
|---|---|---|---|---|---|---|
| A | 1-source | 1-recip | 1-sink | 1-sink | 1-source | 1-sink |
| B | 2-sink | 1-source | all | 2-source | all | all |
| C | 2-sink | all | all | all | 2-sink | 2-source |
| D | 2-source | 1-recip | 1-sink | 1-sink | 1-recip | 1-recip |
| E | 1-source | 1-recip | 1-recip | 2-source | ||
| F | 2-sink | 1-sink | 1-source | 1-recip | 1-recip | |
| G | 1-sink | 1-recip | 1-recip | all | ||
| H | 1-recip | all | 1-source | all | 2-source | 2-source |
| I | all | 1-source | ||||
| J | 1-recip | 1-recip | ||||
| K | 1-sink | 1-recip | 1-sink |
Table 4.
Kendall- and Spearman r coefficients from the correlation analysis for background knowledge and online discussion roles for each period. * Correlation significant at 0.05.
Table 4.
Kendall- and Spearman r coefficients from the correlation analysis for background knowledge and online discussion roles for each period. * Correlation significant at 0.05.
| Kendall- | Spearman r | |||||||||||
|---|---|---|---|---|---|---|---|---|---|---|---|---|
| Role | p1 | p2 | p3 | p4 | p5 | p6 | p1 | p2 | p3 | p4 | p5 | p6 |
| 1 | −0.31 | −0.57 * | 0.09 | −0.32 | −0.36 | 0.12 | −0.43 | −0.75 * | 0.21 | −0.56 | −0.62 | 0.22 |
| 2 | −0.59 * | −0.46 | 0.63 * | 0.32 | −0.21 | −0.53 | −0.74 * | −0.58 | 0.76 * | 0.36 | −0.21 | −0.67 |
| 3 | −0.44 | −0.57 * | 0.26 | −0.32 | −0.54 | −0.84 | −0.67 | −0.75 * | 0.45 | −0.56 | −0.68 | −0.89 * |
| 4 | −0.31 | −0.55 * | 0.20 | −0.22 | 0.15 | 0.32 | −0.48 | −0.70 * | 0.43 | −0.37 | 0.15 | 0.35 |
| 5 | −0.57 * | −0.49 | 0.51 | 0.32 | 0.30 | −0.32 | −0.76 * | −0.62 | 0.67 * | 0.36 | 0.52 | −0.36 |
| 6 | −0.44 | −0.51 | 0.23 | −0.11 | 0.50 | 0.11 | −0.68 * | −0.65 | 0.44 | −0.15 | 0.59 | −0.05 |
| 7 | −0.33 | −0.55 * | 0.26 | −0.22 | 0.30 | −0.12 | −0.62 | −0.70 * | 0.45 | −0.37 | 0.33 | −0.22 |
| 8 | −0.54 * | −0.51 | 0.29 | −0.11 | 0.45 | 0.11 | −0.73 * | −0.65 | 0.47 | −0.15 | 0.58 | −0.05 |
| 9 | −0.42 | −0.55 * | 0.26 | −0.22 | 0.26 | −0.12 | −0.66 | −0.70 * | 0.45 | −0.37 | 0.34 | −0.22 |
Table 5.
Kendall- and Spearman r coefficients from the correlation analysis when student A is ignored. * Correlation significant at 0.05.
Table 5.
Kendall- and Spearman r coefficients from the correlation analysis when student A is ignored. * Correlation significant at 0.05.
| Kendall- | Spearman r | |||||||||||
|---|---|---|---|---|---|---|---|---|---|---|---|---|
| Role | p1 | p2 | p3 | p4 | p5 | p6 | p1 | p2 | p3 | p4 | p5 | p6 |
| 1 | −0.11 | −0.44 | −0.19 | −0.18 | −0.45 | −0.71 | −0.18 | −0.64 | −0.13 | −0.32 | −0.63 | −0.77 |
| 2 | −0.47 | −0.30 | 0.52 | 0.91 | −0.22 | −0.18 | −0.63 | −0.40 | 0.65 | 0.95 | −0.26 | −0.32 |
| 3 | −0.29 | −0.44 | 0.04 | −0.18 | −0.77 | −0.71 | −0.52 | −0.64 | 0.21 | −0.32 | −0.87 | −0.77 |
| 4 | −0.11 | −0.42 | −0.04 | 0.00 | 0.36 | 0.71 | −0.25 | −0.57 | 0.18 | 0.00 | 0.45 | 0.77 |
| 5 | −0.44 | −0.34 | 0.37 | 0.91 | 0.60 | 0.18 | −0.66 | −0.45 | 0.53 | 0.95 | 0.78 | 0.32 |
| 6 | −0.29 | −0.37 | 0.00 | 0.18 | 0.89 * | 0.91 | −0.55 | −0.49 | 0.19 | 0.32 | 0.95 * | 0.95 |
| 7 | −0.14 | −0.42 | 0.04 | 0.00 | 0.60 | 0.71 | −0.45 | −0.57 | 0.21 | 0.00 | 0.67 | 0.77 |
| 8 | −0.40 | −0.37 | 0.07 | 0.18 | 0.84 | 0.91 | −0.61 | −0.49 | 0.24 | 0.32 | 0.89 * | 0.95 |
| 9 | −0.25 | −0.42 | 0.04 | 0.00 | 0.63 | 0.71 | −0.51 | −0.57 | 0.21 | 0.00 | 0.71 | 0.77 |
© 2020 by the authors. Licensee MDPI, Basel, Switzerland. This article is an open access article distributed under the terms and conditions of the Creative Commons Attribution (CC BY) license (http://creativecommons.org/licenses/by/4.0/).
Share and Cite
MDPI and ACS Style
Turkkila, M.; Lommi, H. Student Participation in Online Content-Related Discussion and Its Relation to Students’ Background Knowledge. Educ. Sci. 2020, 10, 106. https://doi.org/10.3390/educsci10040106
AMA Style
Turkkila M, Lommi H. Student Participation in Online Content-Related Discussion and Its Relation to Students’ Background Knowledge. Education Sciences. 2020; 10(4):106. https://doi.org/10.3390/educsci10040106
Chicago/Turabian StyleTurkkila, Miikka, and Henri Lommi. 2020. "Student Participation in Online Content-Related Discussion and Its Relation to Students’ Background Knowledge" Education Sciences 10, no. 4: 106. https://doi.org/10.3390/educsci10040106
Note that from the first issue of 2016, this journal uses article numbers instead of page numbers. See further details here.