
With learners today earning more substantive credentials and, in some cases, academic credits through MOOCs, the authors designed a study to investigate the benefits and costs to learners who are engaging in a series of open, online courses that provide a culminating nondegree credential.

When massive open online courses (MOOCs) first grabbed the attention of major media outlets in 2011, bold claims were made about democratizing education and providing high-quality credentials at a fraction of the costs of traditional degrees. For a research center like ours that studies the cost-effectiveness of educational programs and strategies, MOOCs seemed too good to be true. The prospect of high-quality instruction being offered at mass scale sounded like the perfect candidate for cost-effective education. However, our investigations showed that while it was feasible to assess the cost side of the equation, the benefits were much harder to capture.
Initial Investigation
Initially, we set out to investigate the costs and benefits of MOOCs from the perspective of the institutions offering them—mostly colleges and universities.1 Among the things we heard from these institutions was that MOOCs
- helped them extend their reach and improve access to education;
- helped them build and maintain their brand both in the United States and abroad; and
- inspired many instructors to reconsider their teaching methods and experiment with innovative strategies. Indeed, in a few cases, this led to documented gains in student learning.2
MOOC-related data provided fodder for research on teaching and learning, albeit with study samples limited to a rarefied population of well-educated, self-motivated learners. A few new lessons about online learning transpired from MOOC-based research, such as how students engage in courses and use course materials.3 But, as researchers astutely observed,4 none of these insights were successfully applied to improve the notoriously low course completion rates.
The Cost Factor
Some hoped that MOOCs would improve the economics of higher education, although such hopes seemed somewhat quixotic given that MOOCs cost tens or hundreds of thousands of dollars to build5 and yet were being offered free to most participants. Still, despite persistently low completion rates, researchers found that institutional costs per MOOC completer were far below those for traditional online courses: $74–272 compared with $7,000–10,000.6 If only institutions offering MOOCs could cover their costs, this could be a win-win for both MOOC providers and learners. Some MOOC providers experimented with various revenue-generation models and have been gradually shifting away from free to potentially sustainable.
A Question of Outcomes
The most important unanswered question about the benefits of MOOCs is whether they tangibly improve educational or other outcomes for students. From the learner's perspective, courses that charge no or very low fees are clearly appealing, but the investment of time and effort still demands some sort of return—whether that's a credential, learning for the joy of learning, networking in a chosen field, upskilling toward a new job or promotion, or preparing to embark on a formal degree. Few studies have rigorously investigated the educational gains from participating in MOOCs. But there is more to engaging in educational courses than the potential to gain skills and knowledge. And, in fact, a 2015 survey7 found that, of the respondents who had completed individual MOOCs, 72% reported career benefits and 61% reported educational benefits.
The Rise of MOOC Credentials
By 2014, MOOC providers had begun packaging MOOCs into series of courses. Many of these series include a final capstone project or exam and offer verified documentation of completion. For a fee, completers can earn a nondegree or "alternative" credential.8 Examples of such programs include Specializations, MicroMasters, Nanodegrees [https://www.udacity.com/nanodegree-new], professional certificates, and XSeries. Today, Coursera offers hundreds of Specializations from organizations across the globe, while edX lists 52 MicroMasters from 28 universities.
These alternative credentials are vastly less costly than traditional degrees. The average fee for a MicroMasters is $980. In addition to earning a MicroMasters credential, completers can earn academic credit that they can apply toward a full master's degree, sometimes at the same university and sometimes at a different university. Specializations are priced as subscriptions and range from $39 to $79 per month and offer completers a certificate but no academic credit toward a further degree. For example, Johns Hopkins University's Data Science Specialization consists of nine courses plus a capstone project and costs $49 per month. If a learner completes the program in nine months, it would cost $441.
The Study: Investigating Benefits to Learners
Now that learners can earn a more substantive credential—and, in some cases, academic credit—after completing a series of MOOCs, it seems appropriate to revisit the question of whether and how learners are benefiting from these programs. We hypothesized that learners could gain educationally by studying a topic in greater depth over an extended period of time and by participating in more rigorous projects and assessments. From a career standpoint, the credential could serve as a signal to potential or current employers that the learner is self-motivated, persistent, and has mastered a substantial body of knowledge and skills. To test these ideas, we designed a study to investigate the benefits and costs to learners who are engaging in a MOOC series that provides a culminating, nondegree credential.
In 2017, we developed an online survey to elicit information from MOOC-enrolled learners who were part of a Specialization or MicroMasters program. Our research question was:
What career, financial, educational, or other benefits do learners gain from participating in a MOOC-based course series, and what are the direct costs and opportunity costs of participation?
We created the survey in Qualtrics and included questions about
- the learner's current education, earnings, and career status;
- the educational, career, and other benefits they expected from participating in the course series; and
- the direct costs and opportunity costs of participating.
The questions about costs addressed who was paying for the courses, whether participants were sacrificing paid work time to complete coursework, and whether their employers permitted them to study during paid work time.
We reviewed the list of institutions offering MicroMasters programs on the edX MicroMasters website and sent each U.S. university an invitation to participate in the study. We then reviewed the list of Specializations on the Coursera website and selected a similar number of U.S. universities to invite. We obtained agreement to include the survey in six Specializations and four MicroMasters offered by public and private U.S. universities. For each institution that agreed to include the survey in their programs, we customized the survey to reflect the names and numbers of the courses and the topic of study. The Specializations were in business and finance topics, and the MicroMasters were in social science, computer science, and business and management topics.
A link to the online survey was embedded in the course websites, in a prominent place so that learners would see it as they started the first course in a series. If courses could be taken in any order, the survey link was embedded in each course and only those learners who were taking their first course would complete it.
We collected responses to the survey between February 2017 and August 2018; here, we report the findings from 3,086 learners, of whom 43% were participating in Specializations and 57% were participating in MicroMasters.9
Study Results
Here, we report our survey findings related to learner demographics, employment status, annual income, and learners' plans for further study. We also report on the costs of participating in MicroMasters or Specializations and what learners expected to gain as a result of their participation.
Learner Demographics
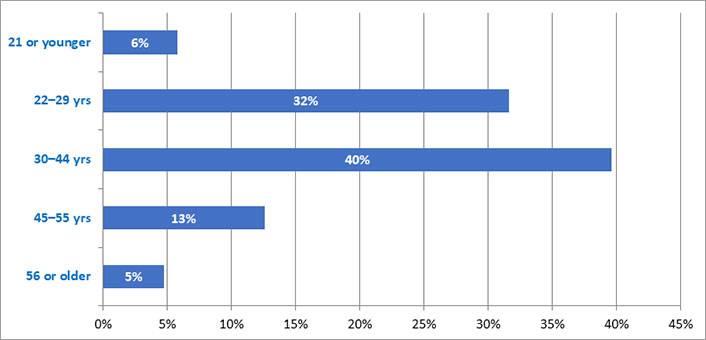
Across all 10 programs, 49% of the learners were male, 49% were female, and 1% identified as "Other." The average age of respondents was 35, and most respondents were between 22 and 44 years old (see figure 1).
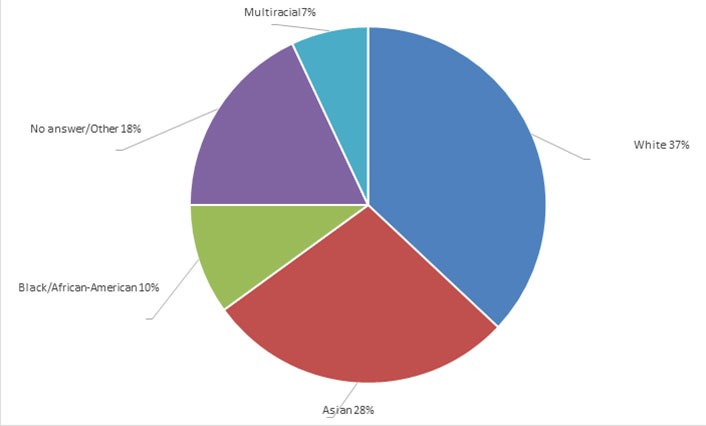
As figure 2 shows, 14% of respondents were Hispanic, and almost two-thirds were White or Asian. When asked about race, 18% of respondents did not answer or answered "Other," with several making it clear that race categories used in the United States are not always applicable in a global context.
Survey respondents lived in 154 different countries, with the largest concentrations in the United States (25%) and India (12%). Brazil, Nigeria, and Canada were each home to 3% of the learners. Table 1 shows the differences in demographics between MicroMasters and Specialization learners. Specialization learners were slightly older and more likely to be female than those in MicroMasters. Learners in MicroMasters programs were more racially diverse and more likely to live in low- or middle-income countries.
|
Characteristic |
Specializations |
MicroMasters |
|---|---|---|
| Female | 56% | 43% |
| Male | 42% | 53% |
| Average age (years) | 36 | 34 |
| Youngest (years) | 8 | 13 |
| Oldest (years) | 79 | 83 |
| Hispanic | 13% | 15% |
| White | 49% | 29% |
| Asian | 23% | 32% |
| Black/African American | 8% | 12% |
| Multiracial | 5% | 8% |
| # of countries with participants | 108 | 142 |
| Most common countries of participants |
U.S. (36%) India (9%) Brazil/Canada (3%) |
U.S. (16%) India (14%) Brazil/Colombia/Nigeria (3%) |
Current Knowledge, Skill, and Education Levels
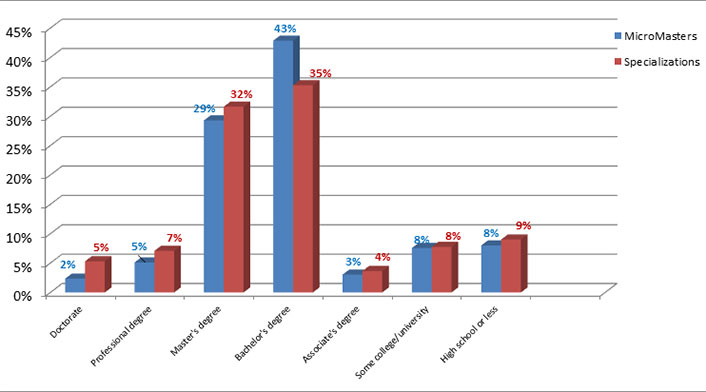
Learners in the 10 programs were generally well educated: 79% held an undergraduate degree or higher, with 40% of them holding a graduate degree (see figure 3). Specialization learners were more likely to have earned a graduate degree than MicroMasters learners. Only 16% of learners had no degree at all, though half of these learners had completed some university or college courses and 17% of this subset indicated that they were taking the courses to improve their application for degree programs.
Participants in the 10 programs reported a high level of English fluency: 55% were fluent, 41% had very good or intermediate English skills, and only 3% had basic or weak English skills. We also asked learners in the MicroMasters programs about their current knowledge level in the program's subject area: 7% claimed to have advanced knowledge or expertise in the topic, 35% claimed intermediate-level knowledge; and 55% identified as beginners.
Employment Status
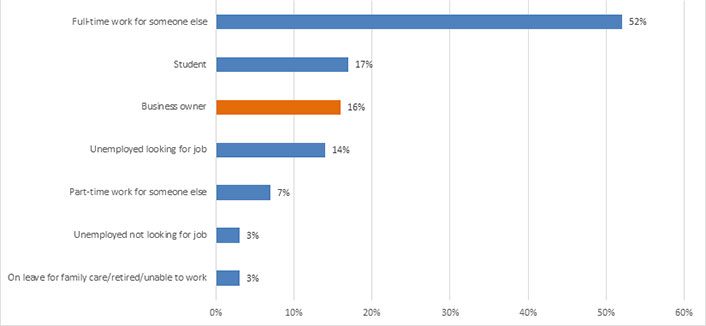
Over half of the learners worked full-time for an employer, while 16% ran their own businesses (see figure 4). The mostly commonly identified professions were marketing, sales, and service; business management and administration; educational services; and professional, scientific, or technical services. Each of these professions was pursued by 3% or more of the participants.
Total Annual Income
Survey questions asked respondents to report annual salary, commissions, bonuses, and total income, all in U.S. dollar amounts. In some cases, these did not appear to be reported correctly as the salary, commission, and bonus amounts did not sum to the total; we therefore report only the total income for respondents. Furthermore, we report median rather than mean income to avoid outliers—such as the MicroMasters participant who reported a total income of $7 million and the Specialization participant who reported a total income of $3.5 million. Although employment status was similar for participants in MicroMasters and Specializations, the median annual income of Specialization participants, $46,000, was double that of MicroMasters participants. Several factors could explain this difference in earning power.
- Almost one-third of Specialization learners lived in the U.S. compared with 16% of the MicroMasters learners, a greater number of whom lived in low- or middle-income countries such as India, Colombia, and Nigeria.
- Specialization participants were more likely to have a graduate degree than MicroMasters participants (44% vs. 36%).
- Specialization topics were in relatively high-earning areas, such as business and finance, whereas the MicroMasters topics were more diverse.
We broke out U.S. participants in the programs to assess earnings compared to the national median. We found that median annual income for U.S. participants in the 10 programs was $70,000, which is substantially higher than median annual income for the general U.S. population, which was reported as $61,372 in 2017 by the United States Census Bureau.
Expected Benefits of Participation
The most commonly identified benefit expected as a result of participating in the MOOC-based course series was improving current job performance (see Table 2). Small percentages of participants were asked to take the courses by their employers: 1.4% of MicroMasters participants and 2.8% of Specialization participants. Approximately one-fourth of learners expected benefits of participation to include helping them start their own businesses, improving their applications to different jobs, and networking with other professionals. Few respondents identified job promotions and pay raises as the expected benefits, perhaps suggesting a group of learners with high levels of intrinsic motivation. In general, MicroMasters learners had higher expectations than Specialization learners regarding the benefits of participating in the series of courses.
|
Benefit Expected |
% of All Learners |
% of Specialization Learners |
% of MicroMasters Learners |
|---|---|---|---|
| Improve my performance in current job | 44% | 42%* | 45% |
| Help me start my own business | 27% | 25% | 28% |
| Learn something new | 26% | 26% | 26% |
| Network | 23% | 19% | 25% |
| Improve application for a different job | 23% | 19% | 25% |
| Improve my English | 21% | 19% | 22% |
| Supplement a formal degree program | 16% | 13% | 18% |
| Improve application to a formal degree program | 12% | 12% | 12% |
| Help me get a job promotion | 11% | 13% | 12% |
| Help me get a pay raise | 9% | 9% | 9% |
| Improve my application to a first job | 9% | 7% | 11% |
Plans for Earning the Alternative Credential
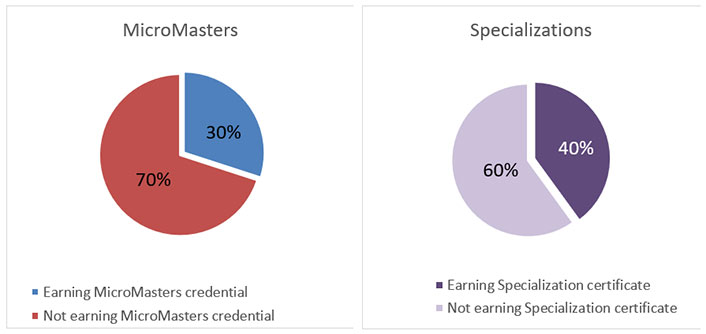
As figure 5 shows, 30–40% of participants in the course series planned to complete the series and earn the Specialization certificate or MicroMasters credential. As the figure also shows, the percentage was higher for Specialization learners than for those in MicroMasters programs. Another quarter of participants planned to complete all the courses in the series, but not earn the credential.
Plans for Applying to a Degree Program
Learners were asked to indicate their plans for applying to a further degree program after completing the course series. Among the MicroMasters learners (n = 1,745), 9% planned to apply to the Master's program with which the MicroMasters was associated. In addition, 5% of all respondents across all 10 programs indicated that they planned to apply to a degree program (not associated with the MicroMasters for the MicroMasters participants) at the same university that was offering the MicroMasters or Specialization. Another 5% of all respondents planned to apply to a degree program at a different university, while 23 percent indicated that they would not be applying for any further degree program. This number was higher for Specializations (28%) than for MicroMasters (19%).
Costs of Participating in MOOC-based Course Series
Some individual MOOC courses can be audited (taken for no fee), though participants must pay a fee or request financial aid in order to earn the MicroMasters or Specialization credential. Specialization fees are $39–79 per month, totaling a few hundred dollars per program depending upon the amount of time participants take to complete it. MicroMasters programs are offered for a fixed fee. Across all 52 MicroMasters programs currently offered on the edX platform, the price ranges from $540 to $1,500. Overall, MicroMasters are more costly than Specializations; the estimated average fees for each of the four MicroMasters programs included in this study was $980, compared with an average of $360 for each of the six Specializations. We calculated these fees based on the information provided on the edX and Coursera websites. The fees represent 4% of median income for MicroMasters participants and 1% of median income for Specialization participants in our sample.
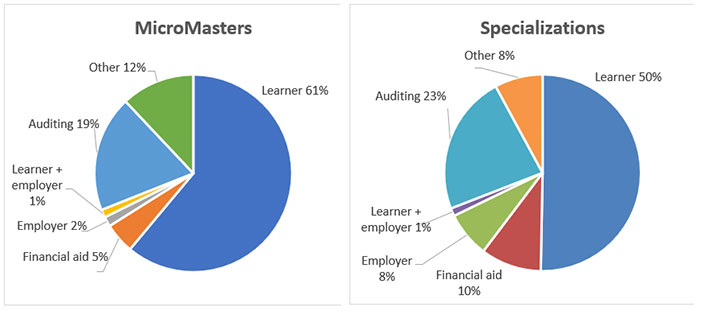
Across all 10 programs, 56% of participants were paying for the courses themselves, 21% were auditing the courses, and 7% were receiving financial aid from the platform provider (Coursera or edX). Employers were covering the fee payments for 4% of the learners and were splitting the course fees with another 1%. Only 2% of participants were being paid by their employer for the time spent working on the courses. As figure 6 shows, we found some differences between Specializations and MicroMasters in terms of who was paying the fees. Employers were paying the course fees for 8% of Specialization learners but for only 2% of MicroMasters learners. Further, 10% of Specialization participants were receiving financial aid from the platform provider (Coursera) compared with 5% of MicroMasters participants.
Opportunity Costs
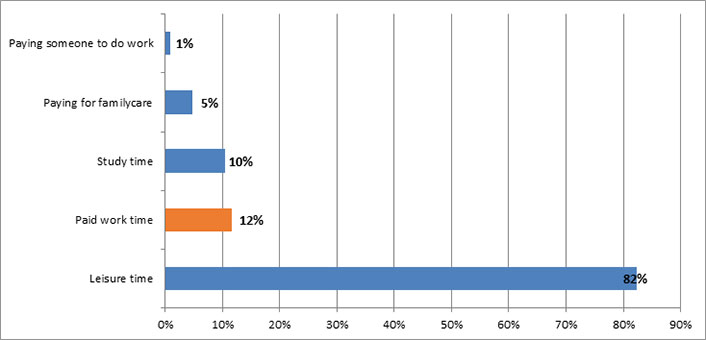
As figure 7 shows, the vast majority of participants in both Specializations and MicroMasters were giving up unpaid leisure time to work on the courses. However, 12% were giving up paid work time and 10% were giving up study time in a formal degree program. In addition, a few participants were paying others to look after their families or do their regular work while they studied in the courses.
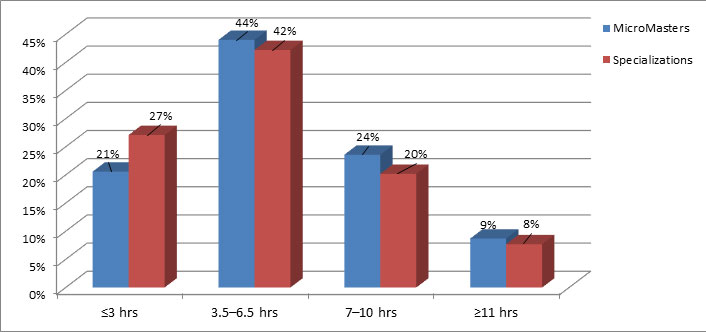
MicroMasters appear to be more time-consuming than Specializations. Based on the guidelines from the providers of the MicroMasters in our study, students were expected to spend a total of 197 hours for the entire program, spread across 34 weeks—for an average of 5.8 hours per week. For the six Specializations, course guidelines indicated that students should spend a total of 57 hours for the whole program, spread across 21 weeks—for an average of 2.7 hours per week. These guidelines are posted as part of the course information on the edX and Coursera websites. As figure 8 shows, however, our surveyed learners expected to spend more time on the courses—an average of 6.5 hours per week— than either program estimated.
Next Steps
We recently created a survey that is administered at the end of each course series asking questions similar to those in the initial survey. Our intention was to compare participants' earnings, career status, and education status at the beginning and end of the program, as well as to gather information about benefits that have materialized during the program period. Although 60% of participants indicated in the beginning-of-program survey that they planned to complete all courses in the series, in reality we have collected very few end-of-program survey responses compared with the number of pre-surveys.
For example, in one program, we have now received approximately 2,600 responses to the pre-survey but only 26 responses to the end-of-program survey. It is as yet unclear whether the low response rate is due to low program completion, slow completion, survey fatigue, posting the survey in a poor location, or a combination of all of these factors. However, we have reason to believe from other sources that low completion rates are a major culprit. For example, we administered an anonymous survey in our September 2018 webinar about MOOCs and Specializations, which was primarily attended by online learning administrators and instructional designers. In response to a question about completion rates for Specializations, 10 participants indicated completion rates of 15% or less at their institutions, and 8 of these 10 indicated rates of 5% or less. These numbers are in line with reported completion rates for individual MOOCs.10
As a result of the low program completion and survey response rates, we expect that it will be difficult to track individual learners from the beginning to the end of a program as originally intended. We have therefore begun adding new programs to the study to increase the number of responses we can expect for end-of-program surveys. We are also collecting participants' consent for future follow-up by email with the intention of sending a third survey approximately 12 months after the learner has completed the credential. This survey will assess changes in education, earnings, and career status since completing the credential. One of the outcomes we plan to investigate is how many MicroMasters students are able to progress to a full master's degree. Encouragingly, 78% of participants in the pre-survey have given consent for future contact.
Conclusions
As previously found for stand-alone MOOCs,11 a typical MicroMasters or Specialization learner is well-educated, employed, White or Asian, and older than traditional college-going students. Many participants in these programs have no intention of earning the credential or pursuing a further degree upon completion. They mostly expect career benefits, including improving their job performance, helping themselves start a new business, improving their applications to a different job, or networking with other professionals. These findings suggest that these programs are more akin to professional training for on-the-job employees than to a traditional college education.
For those learners that earn the MicroMasters or Specialization credential, the costs are much lower than a traditional college credential. Despite the potential benefits to employers of low-cost professional development for their employees, few are stepping up to contribute to fees or pay their employees for their time spent acquiring additional skills. However, if this small trend continues upward, it will be an important sign of growing recognition by employers of the value of these courses and credentials.
Despite considerable unknowns, it is clear that MOOC-based course series will not be replacing college degrees any time soon. Even for well-educated participants, completion of a course series appears to be a challenge—or perhaps simply a low priority. Also in line with previous findings12 for stand-alone MOOCs, few participants in the series who claimed they will complete all courses actually do so. Finally, it is yet to be determined whether students who lack preparation in a topic area (such as through a two-year or an undergraduate degree) can persist in these course series and earn a credential of economic value. For now, these types of alternative credentials may be finding their niche in providing low-cost, on-the-job upskilling.
Notes
- Fiona M. Hollands and Devayani Tirthali, MOOCs: Expectations and Reality. Full report, Center for Cost-Benefit Studies of Education, Teachers College, Columbia University (2014); Fiona M. Hollands and Devayani Tirthali, "Why Do Institutions Offer MOOCs?" Online Learning 18, no. 3 (2014); and Fiona M. Hollands and Devayani Tirthali, MOOCs in Higher Education: Institutional Goals and Paths Forward (New York: Palgrave Macmillan, 2015). ↩
- For example, Kimberly F. Colvin, John Champaign, Alwina Liu, Qian Zhou, Colin Fredericks, and David E. Pritchard, "Learning in an Introductory Physics MOOC: All Cohorts Learn Equally, Including an On-campus Class," The International Review of Research in Open and Distributed Learning 15, no. 4 (2014). ↩
- For example, Allison Zengilowski, Sidhant Wadhera, and Karen Harpp, "Engaging Alumni and Students Using Online Education Technology," EDUCAUSE Review, November 9, 2015; and Kenneth R. Koedinger, Jihee Kim, Julianna Zhuxin Jia, Elizabeth A. McLaughlin, and Norman L. Bier, "Learning Is Not a Spectator Sport: Doing Is Better than Watching for Learning from a MOOC," Proceedings of the Second ACM Conference on Learning@Scale (2015): 111–120. ↩
- Justin Reich and José A. Ruipérez-Valiente, "The MOOC Pivot," Science 363, no. 6423 (2019): 130–131. ↩
- Fiona Hollands and Devayani Tirthali, "Resource Requirements and Costs of Developing and Delivering MOOCs," International Review of Research in Open and Distributed Learning 15, no. 5 (2014): 113–133. ↩
- Ibid, 127. ↩
- Chen Zhenghao, Brandon Alcorn, Gayle Christensen, Nicholas Eriksson, Daphne Koller, and Ezekiel Emanuel, "Who's Benefiting from MOOCs, and Why," Harvard Business Review, September 15, 2015. ↩
- Adam Gordon, "MicroMasters' Surge as MOOCs Go from Education to Qualification," Forbes, February 13, 2018; Paul Fain, On-Ramps and Off-Ramps: Alternative Credentials and Emerging Pathways Between Education and Work, report, Inside Higher Ed (September 19, 2018); and Laurie Pickard, Analysis of 450 MOOC-Based Microcredentials Reveals Many Options But Little Consistency, report, Class Central, July 18, 2018. ↩
- Results of this survey are also available as part of a webinar, Innovations in Online Learning: Benefits and Costs of Alternative Credentials, delivered in September 2018. The webinar included presentations from three universities about their own Specializations and MicroMasters programs. In addition to the full video recording of the webinar, our webinar slides are also available. ↩
- Katy Jordan, "Initial Trends in Enrolment and Completion of Massive Open Online Courses," The International Review of Research in Open and Distributed Learning 15, no. 1 (2014). ↩
- Andrew Ho, Justin Reich, Sergiy Nesterko, Daniel Seaton, Tommy Mullaney, Jim Waldo, and Isaac Chuang, HarvardX and MITx: The First Year of Open Online Courses, Fall 2012-Summer 2013, working paper no. 1, HarvardX and MITx (2014); Gayle Christensen, Andrew Steinmetz, Brandon Alcorn, Amy Bennett, Deirdre Woods, and Ezekiel Emanuel, The MOOC Phenomenon: Who Takes Massive Open Online Courses and Why? working paper, University of Pennsylvania (2013). ↩
- Justin Reich, "MOOC Completion and Retention in the Context of Student Intent," EDUCAUSE Review, December 8, 2014. ↩
Fiona Hollands is the Associate Director and Senior Researcher at the Center for Benefit-Cost Studies of Education (CBCSE) at Teachers College, Columbia University.
Aasiya Kazi is a Researcher at the Center for Benefit-Cost Studies of Education (CBCSE) at Teachers College, Columbia University.
© 2019 Fiona Hollands and Aasiya Kazi. The text of this article is licensed under the Creative Commons Attribution-NonCommercial 4.0 International License.